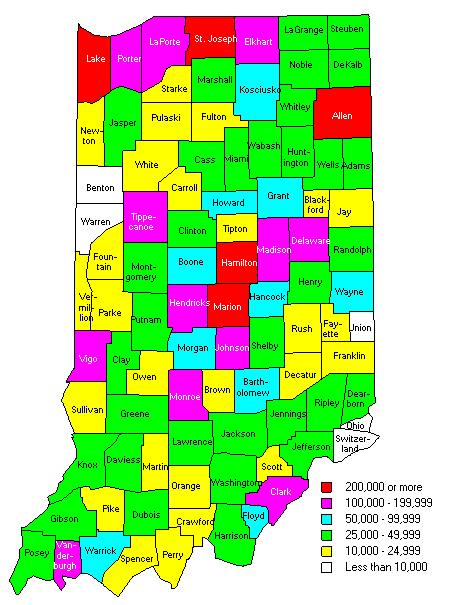
| Age | Both Sexes | Male | Female |
|---|---|---|---|
| All Ages | 6,226,537 | 3,063,751 | 3,162,786 |
| <5 | 430,019 | 219,815 | 210,204 |
| 5-9 | 438,292 | 224,329 | 213,963 |
| 10-14 | 462,987 | 237,968 | 225,019 |
| 15-19 | 445,130 | 227,682 | 217,448 |
| 20-24 | 455,553 | 232,181 | 223,372 |
| 25-29 | 410,889 | 210,005 | 200,884 |
| 30-34 | 412,862 | 208,972 | 203,890 |
| 35-39 | 425,575 | 214,299 | 211,276 |
| 40-44 | 479,464 | 238,832 | 240,632 |
| 45-49 | 468,556 | 232,736 | 235,820 |
| 50-54 | 414,871 | 205,010 | 209,861 |
| 55-59 | 346,166 | 168,844 | 177,322 |
| 60-64 | 265,891 | 127,579 | 138,312 |
| 65-69 | 213,186 | 99,602 | 113,584 |
| 70-74 | 174,383 | 75,591 | 98,792 |
| 75-79 | 160,732 | 66,429 | 94,303 |
| 80-84 | 117,926 | 43,758 | 74,168 |
| 85+ | 104,055 | 30,119 | 73,936 |
| Age | All Races | White | African-American | Other |
|---|---|---|---|---|
| All Ages | 6,226,537 | 5,557,044 | 570,002 | 99,491 |
| <5 | 430,019 | 370,404 | 52,671 | 6,944 |
| 5-9 | 438,292 | 377,652 | 53,103 | 7,537 |
| 10-14 | 462,987 | 400,821 | 55,597 | 6,569 |
| 15-19 | 445,130 | 390,209 | 47,991 | 6,930 |
| 20-24 | 455,553 | 399,272 | 47,099 | 9,182 |
| 25-29 | 410,889 | 358,583 | 42,109 | 10,197 |
| 30-34 | 412,862 | 362,188 | 39,817 | 10,857 |
| 35-39 | 425,575 | 378,816 | 37,489 | 9,270 |
| 40-44 | 479,464 | 431,249 | 40,283 | 7,932 |
| 45-49 | 468,556 | 424,291 | 37,725 | 6,540 |
| 50-54 | 414,871 | 378,292 | 31,089 | 5,490 |
| 55-59 | 346,166 | 319,222 | 22,649 | 4,295 |
| 60-64 | 265,891 | 246,049 | 17,038 | 2,804 |
| 65-69 | 213,186 | 197,422 | 13,789 | 1,975 |
| 70-74 | 174,383 | 161,943 | 11,185 | 1,255 |
| 75-79 | 160,732 | 150,700 | 9,169 | 863 |
| 80-84 | 117,926 | 111,459 | 6,016 | 451 |
| 85+ | 104,055 | 98,472 | 5,183 | 400 |
Source: Surveillance, Epidemiology, and End Results (SEER) Program of the National Cancer Institute.
