HIV Disease
Acquired Immune Deficiency syndrome (AIDS)
and Human Immunodeficiency Virus (HIV)
Rates per 100,000 population December 31, 1998
Cases |
Rate per |
|
| AIDS cases reported | ||
|
5,445 |
-- |
| Crude AIDS point prevalence rate: | ||
|
2,200 |
37.5 |
| Sex-specific AIDS point prevalence rate: | ||
|
253 |
8.4 |
| Race-specific AIDS point prevalence rate: | ||
|
1,522 |
28.6 |
| HIV-infected cases reported: | ||
|
3,123 |
-- |
| Crude HIV point prevalence rate: | ||
|
2,941 |
50.2 |
| Sex-specific HIV point prevalence rate: | ||
|
511 |
17.0 |
| Race-specific HIV point prevalence rate: | ||
|
1,783 |
33.6 |
| Crude HIV Disease Rate (HIV and AIDS): | 87.7 |
|
Number of AIDS Cases Reported
The number of AIDS cases reported in 1998 decreased from the number reported in 1997 in Indiana (Table 1), consistent with the national trend. The decrease in reported AIDS cases does not necessarily indicate a decrease in HIV infection diagnoses in 1998, but does demonstrate the effect of medications that are preventing or delaying severe immunosuppression (AIDS). Of the AIDS cases reported in 1998, 239 (50%) were diagnosed in 1998. The remaining cases were diagnosed from 1984 to 1997 and reported first in 1998.
Table 1.
AIDS cases reported in 1995-1998 for Indiana and the U.S.
1994 |
1995 |
1996 |
1997 |
1998 |
|
| Indiana | 626 |
485 |
610 |
505 |
480 |
| United States | 80,691 |
73,767 |
69,151 |
60,634 |
48,269 |
Of those diagnosed with AIDS in 1998, 261 (54%) were initially diagnosed as AIDS due to
suppression of the CD4 below 200/mm3. Of those reported with AIDS in 1998, 194
(39%) were diagnosed with AIDS at the same time that they were first diagnosed as being
infected with HIV. Fifty-six percent (n = 269) were diagnosed with AIDS within two months
of being identified as being infected with HIV. These people did not know they were
infected with HIV until they became symptomatic with AIDS. They were not receiving medical
care prior to becoming severely immunosuppressed.
Persons Living with HIV Disease
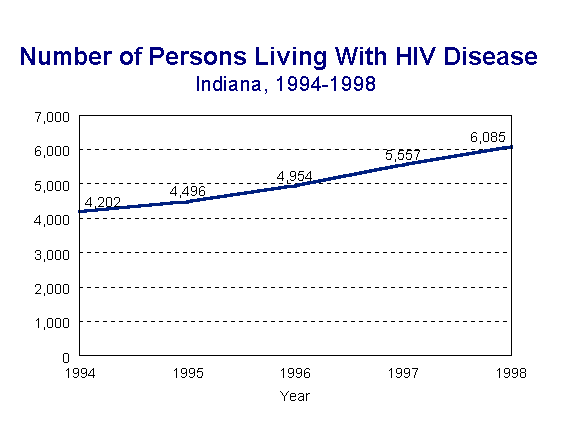
The number of people reported as living with HIV disease (HIV infections and AIDS) continues to increase (Figure 1). During 1998, there were 6,085 living with HIV Disease in Indiana. This includes those that were residents of Indiana when first diagnosed and those that have moved to Indiana since they were diagnosed. The number of reported cases does not account for all of the people living with HIV disease. In addition to the over 6,000 people that have been diagnosed and reported, there are others who have tested positive for the HIV, but are not receiving health care services, plus those who are infected but do not know their HIV status. Indications of both of these facts is found in the number of people that are reported years after their initial diagnosis and the number of people that were diagnosed with severe immunosuppression at, or near, the same time they were diagnosed as being infected.
Figure 1.

Pediatric HIV Disease and Exposure to HIV
Pediatric HIV and AIDS cases are included in the cases reported above. But there are additional children and families impacted by HIV infection even without a diagnosis of HIV disease. By the end of 1998, there had been 211 children born to women in Indiana who had HIV disease. The diagnostic status of these children at the end of 1998 is summarized in Table 2.
Table 2.
Diagnostic Status of Children Born to HIV-Infected Mothers
Indiana, cumulative through 1998
Diagnostic Category |
Children |
| Exposed: born to a woman who is HIV positive, but testing has not yet determined child's HIV status, or the child was lost to follow-up before HIV status was determined | 59 |
| HIV Infected: HIV positive by laboratory testing | 29 |
| AIDS: meets case definition for pediatric AIDS | 31 |
| Seroreverter: mother is HIV positive, but child is HIV negative based on laboratory tests | 92 |
| Total | 211 |
HIV Counseling and Testing
Indiana law requires that all pregnant women are counseled about HIV infection and offered HIV testing. Women who test positive for HIV can prevent perinatal transmission to their infants by taking appropriate and referred therapy during pregnancy and delivery, and administered treatment to their infants after birth. HIV counseling and testing (CT) is available in Indiana, either free of charge or for a nominal fee. CT sites are located throughout the state. The percentage of HIV positive clients decreased again in 1998 to less than 1% (0.98%) (Table 3). This represents 239 HIV infected people. The positivity rate for those tested under the anonymous protocol was 1.57% (98 of 6,229); and for those tested confidentially, it was 0.77% (140 or 17,986). Of the positive test results, 119 (50%) were done with people who had previously tested positive (repeating a positive test). There were 10,201 tests done with people who had previously tested negative.
Table 3.
Counseling and Testing Sites, Tests, and HIV Positive Results
Indiana, 1994-1998
Year |
Number CT Sites |
Number Tests |
Number Positive |
Percent Positive |
1994 |
120 |
28,779 |
353 |
1.2 |
1995 |
149 |
31,608 |
446 |
1.4 |
1996 |
154 |
28,937 |
317 |
1.1 |
1997 |
154 |
24,835 |
318 |
1.3 |
1998 |
159 |
24,348 |
239 |
1.0 |
The percentage of tests that were done confidentially increased again in 1998 to 74%
(Table 4). Anonymous testing is also available at Counseling and Testing sites. Private
providers cannot test anonymously. Persons tested anonymously are not able to document
their HIV status and therefore cannot access follow-up medical, social, or mental health
services. Many counseling and testing sites also offer tuberculosis testing and immune
function testing by CD4 count to those who test positive for the HIV. CT sites also refer
clients for medical care, social services, and HIV care coordination. Other resources
available at CT sites are mental health care, housing advice, and legal services by
referral to care coordination.
Table 4.
Counseling and Testing Sites Percent Anonymous and Confidential Test
Indiana 1994-1998
Year |
% Anonymous |
% Confidential |
1994 |
35 |
65 |
1995 |
35 |
65 |
1996 |
33 |
67 |
1997 |
28 |
72 |
1998 |
26 |
74 |
Even though CT clients are self-selected, the demographic distribution of CT clients with
positive tests for HIV are similar to that of cases reported by sources other than CT.
Demographics
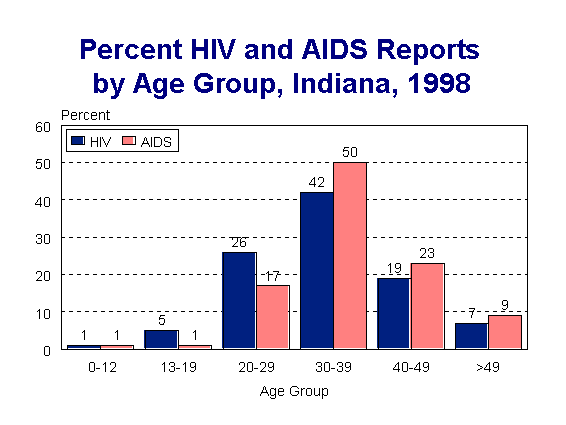
Figure 2.

Gender
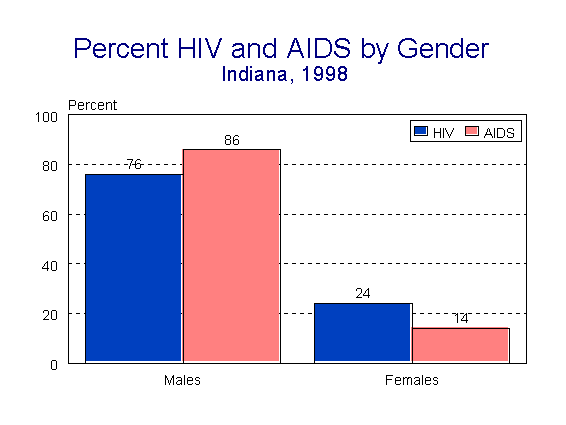
Males (76%) continue to be the sex more affected by HIV disease in Indiana (Figure 3). But, the proportion of female HIV cases continues to be higher than that for AIDS among females. In 1998, females comprised 14% of all reported AIDS cases in Indiana, and 24% of all reported HIV cases. The increase in the proportion of females reported with HIV infection indicates a more rapid increase in HIV disease among women than among men.
Figure 3.
Race/Ethnicity
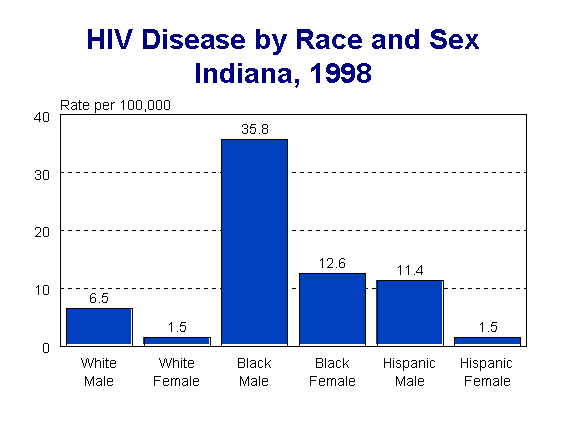
HIV disease cases in Indiana have been predominately White; but minority populations are disproportionately affected by HIV infection when taking into account the burden of disease based on population size (Table 5). In Indiana, the 1998 race-specific rate of HIV disease per 100,000 was 7.8 for Whites as compared to 43.9 for Blacks and 17.8 for Hispanics. In reporting the race/ethnicity of HIV disease, the White race is reported as White, non-Hispanic and the Black race is reported as Black, non-Hispanic. Hispanic ethnicity is reported as the person identifies themselves to health care professionals, or as the health care professionals believe the person to be. There is not comparable census data for the Hispanic ethnicity as it is reported for HIV disease.
Table 5.
HIV and AIDS Case Reports by Race/Ethnicity
Percent of Reported Cases in Indiana, 1998
% of Indiana |
% of HIV Infection |
% of AIDS |
|
| White | 90.6 |
63 |
65 |
| Black | 8.5 |
34 |
31 |
| Hispanic | 1.2 |
3 |
4 |
For race and sex-specific rates, the distinctions are more broad and point to the
populations most impacted by HIV disease (Figure 4). Black males and females both have
much higher rates than their White or Hispanic counterparts. The number of Asian, Pacific
Islanders, American Indians, and Alaskan Natives reported in Indiana are too small to be
analyzed. Cumulatively, they are less than one percent of the reports.
Figure 4.

Mode of Transmission (Risk Factor or Risky Behavior)
For adults and adolescents in Indiana, the major risk factor remains men who have sex with other men (MSM) (Table 6). Even though MSM was the most frequently reported risk factor in 1998 for persons reported with AIDS, it has declined from 62% in 1994 to 51% in 1998. For those reported as being infected with HIV, MSM was an identified risk factor in 40% of all reports (Table 7). The apparent reduction among those reported with HIV infection should be interpreted with caution because 25% have not reported a risk factor at this time. It is typical for new reports to not contain a risk factor, especially HIV infection reports. The risk factors are reported later. If the risk factors were all identified, the transmission pattern may be slightly different.
Table 6.
Risk Factor Distribution, Percent of Adult and Adolescent AIDS
Indiana, 1994-1998
1994 |
1995 |
1996 |
1997 |
1998 |
|
| MSM (men who have sex with men) | 62 |
64 |
61 |
53 |
51 |
| IDU (injecting drug user) | 13 |
11 |
12 |
14 |
13 |
| MSM/IDU | 17 |
8 |
7 |
6 |
6 |
| Coagulation Disorder Treatment | 1 |
0 |
1 |
0 |
1 |
| Heterosexual Contact with HIV+ person | 8 |
7 |
10 |
13 |
11 |
| Transfusion/Transplant | 2 |
1 |
1 |
0 |
1 |
| Not Reported | 6 |
9 |
8 |
14 |
17 |
Table 7.
Mode of Transmission, Number and Percentage of HIV and AIDS Reports
Adult and Adolescent, Indiana , 1998
HIV |
AIDS |
|||
Number |
Percent |
Number |
Percent |
|
| MSM | 137 |
40 |
244 |
51 |
| IDU | 35 |
10 |
61 |
13 |
| MDM & IDU | 11 |
3 |
30 |
6 |
| Coagulation Disorder Treatment | 1 |
0 |
3 |
1 |
| Heterosexual Contact with HIV+ person | 65 |
19 |
54 |
11 |
| Transfusion/Transplant | 2 |
1 |
4 |
1 |
| Not Reported | 89 |
25 |
83 |
17 |
Racial and ethnic differences also appear when comparing risk factors (Table 8). For
example, 66% of White males reported MSM activity as compared to 43% of Black males and
35% of Hispanic males.
Table 8.
Risk Factor Distribution by Race/Ethnicity and Sex,
Percent of Adult and Adolescent AIDS
Indiana, 1998
Risk Factor |
White |
Black |
Hispanic |
| Male | N=285 |
N=113 |
N=17 |
| MSM | 66 |
43 |
35 |
| IDU | 7 |
26 |
29 |
| MSM/IDU | 8 |
7 |
0 |
| Coagulation Disorder | 1 |
1 |
0 |
| Heterosexual Contact | 3 |
4 |
6 |
| Transfusion | 0 |
1 |
0 |
| Not Reported | 14 |
18 |
29 |
| Female | N=28 |
N=36 |
N=1 |
| IDU | 14 |
11 |
0 |
| Heterosexual Contact | 68 |
44 |
100 |
| Transfusion | 7 |
0 |
0 |
| Birth to high risk/"+" mother | 4 |
0 |
0 |
| Not Reported | 7 |
42 |
0 |
Transmission of HIV via blood components and whole blood has remained low in Indiana.
AIDS Related Deaths
There have been 3,038 cumulative deaths among people infected with HIV in Indiana. The number of people with AIDS that died in 1998 (n = 158) is less than the number that died in 1997 (n = 207). This is a change from the previous pattern of increasing deaths each year from HIV. The change is due to the availability of new medications for HIV. With fewer people developing severe immunosuppression, there are fewer opportunistic infections which are the cause of most AIDS-related deaths.
[an error occurred while processing this directive]