Appendix A
Indiana Influenza Surveillance, 1998-99
James F. Howell, D.V.M., M.P.H.
Epidemiology Resource Center and Communicable Disease Division
Indiana State Department of Health
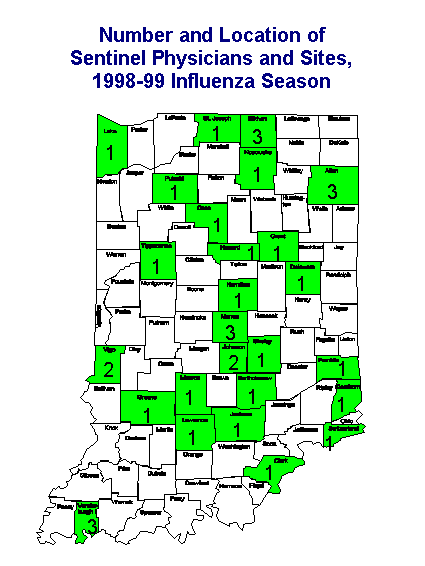
Influenza surveillance during the 1998-1999 influenza season was conducted in cooperation with the Centers for Disease Control and Prevention (CDC). Thirty-seven Indiana physicians, nurse-managed clinics, and university student health centers volunteered to be sentinel physicians/sites. Of that number 29 submitted morbidity reports and 27 submitted nasopharyngeal cultures for virus isolation. Sentinel reporting location and the number by county are provided in Figure 1.
Figure 1.

During each week of the surveillance period, CDC week 9840 (ending Sat. Oct. 10, 1998) to CDC week 9920 (ending Sat., May 20, 1999), sentinel sites tracked the number of patients requesting care for "influenza-like illness" by age groups. "Influenza-like illness" is defined for the purpose of surveillance by CDC as "Fever (> 1000 F. [37.80 C], oral or equivalent) and cough or sore throat (in absence of a known cause)" and the total number of patients seen. Each week sentinel sites were asked to report these figures to CDC via telephone or facsimile. Participants were also asked to collect nasopharyngeal swabs from patients presenting with "influenza-like illness" whose onset of clinical signs had started within 72 hours and send them to the Indiana State Department of Health (ISDH) Laboratory. The ISDH Laboratory conducted viral isolation and identification by influenza type and subtype.
During the surveillance period, sentinel sites reported seeing 145,717 patients with 4,372 seeking care for "influenza-like illnesses." Figure 2 provides a graphical display of the percent of patients presenting with "influenza-like illness" by the week. The occurrence of "influenza-like illnesses" during the 98-99 period followed a similar pattern to the 97-98 period. The number of patients exceeding 3% peaked on the same week (week 5), but the percentage of patients with "influenza-like illness was much higher and stayed above 3% for eleven weeks for the 98-99 season versus 6 weeks in the 97-98 surveillance period.
Figure 2.
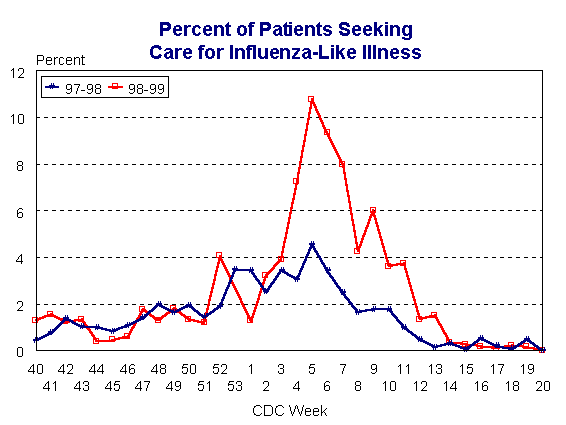
It has been CDC's experience that when "influenza-like illness" patients represents less than 3% of patients seen, the cause is primarily respiratory viruses other than influenza, but once the "influenza-like illness" percentage exceeds 3%, influenza viruses dominate. The first positive influenza virus isolations occurred during week 9901. The "influenza-like illness" percent had exceeded 3% the previous week and would exceed 3% for the next 10 weeks. Figure 3 presents the results of nasopharyngeal culturing of "influenza-like illness" patients. It should be noted that no influenza isolates were identified when the "influenza-like illness" percent was less than 3%. Unlike the two previous influenza seasons, Influenza B and Influenza A occurred simultaneously during the 98-99 season. Typed influenza isolates were the same as those present the 1998 influenza vaccine.
Figure 3.
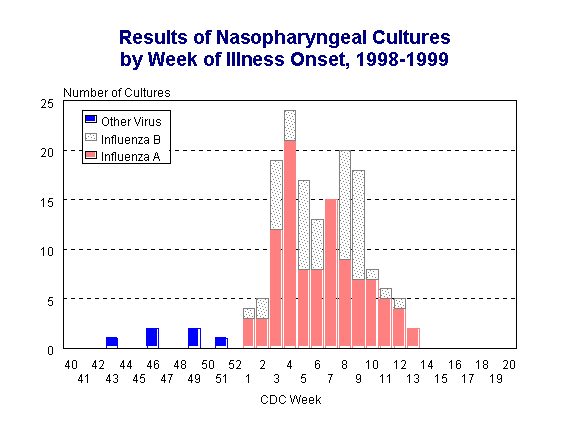
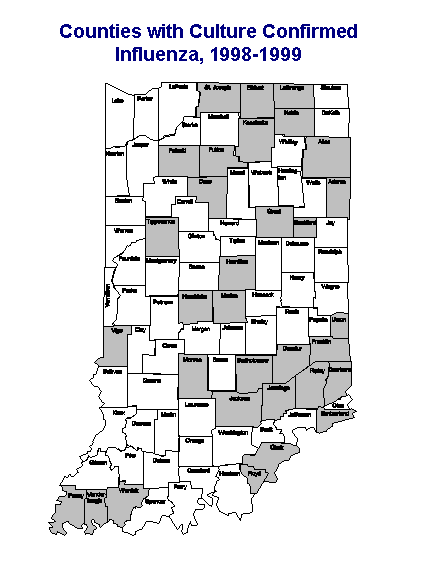
Influenza A and influenza B infections were widely distributed across the state. Of the 181 influenza cultures that were type-able by the ISDH Laboratory, 114 (63%) were influenza A virus and 67 (37%) were influenza B virus. Figure 4 presents the geographic distribution of 32 counties where there were ISDH laboratory confirmed influenza cases. This distribution pattern is biased by the locations of Influenza Surveillance Sentinel Sites.
Figure 4.
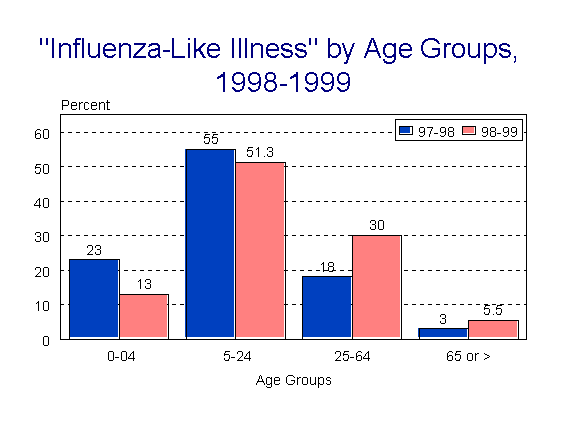
Age distribution of patient's seeking care for "influenza-like illness" varied somewhat from the 1997-1998 Surveillance period (see Figure 5). The 5-24 year old group represented over 50% of those seeking medical care for "influenza-like illness" for both the 1997-98 and the 1998-99 surveillance periods. However the 24-64 year old group replaced the 0-04 year old group as the second most frequent age group seeking care, increasing from 18 % to 30% of patients.
Figure 5.
