Cases = 6,643
Crude Rate (per 100,000) = 113.7
Sex-specific rates:
Female = 116.0
Male = 111.1
Race specific rates:
African American = 931.3
White = 26.0
Other = ( 59 cases)
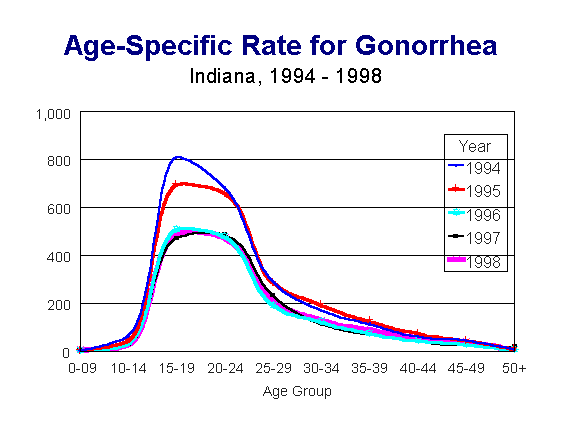
Indiana gonorrhea morbidity has remained essentially unchanged for the past three years following a 30% drop from 1996 (6,658 cases from 1995 (9,224 cases). Figure 1 shows the gonorrhea case rate by age group for 1998.
Figure 1.

Although all age groups have experienced similar rate reductions since 1994, there was no significant change in any age group from 1996 to 1998. The highest age ranges are still the 15 to 19 year old and 20 to 23 year old ranges.
Table 1 shows the gonorrhea rate by metropolitan areas for three of the counties with the highest incidence: Allen, Lake and Marion. Although these counties comprise only 28% of the state’s population, they accounted for 68% of the reported cases in 1998.
Table 1.
Number of Cases of Gonorrhea by County
County |
Number of Cases |
| Allen | 621 |
| Lake | 512 |
| Marion | 3,405 |
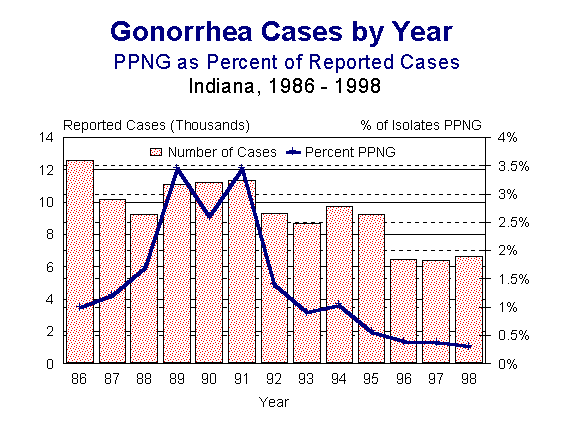
Very few cases of penicillinase producing Neisseria gonorrhoeae (PPNG) cases were reported prior to 1989. Figure 2 illustrates the annual number of gonorrhea cases in the state from 1986 to 1998, and the proportion of isolates tested that were PPNG. In 1990, all public STD clinics in Indiana as well as family planning clinics began to treat gonorrhea with non-peniciliin regimens. The decrease in the proportion of PPNG isolates may reflect this change in treatment.
Figure 2.
Cases = 334
Crude Rate (per 100,000) = 5.7
Sex-specific rates:
Female = 5.8
Male = 5.6
Race specific rates:
African American = 60.0
White = 0.7
Figure 3 shows the number of early syphilis cases reported for 1994 through 1998. There were 9% more early cases of syphilis reported in 1998 than there were in 1997 (334 vs.317). Intervention methods employed in Allen and Lake Counties are likely contributing to the relatively low number of cases. Marion County experienced an increase of over 100% from 102 cases in 1997 to 207 cases in 1998. The reduction in case incidence in other areas of the state masks this phenomenon. Disease increases began in mid 1998 and continued throughout the remainder of the year.
Figure 3.
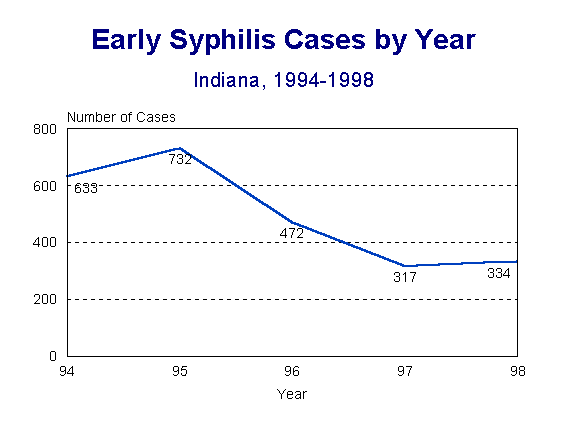
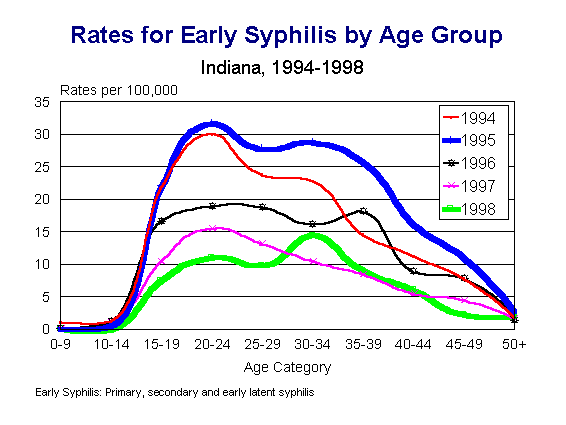
Figure 4 depicts age-specific rates for early syphilis in 1994-1998. Rates for each age group in 1997-1998 remained constantly lower than each of the three previous years (1994-1996).
Figure 4.
Cases = 11,267
Crude Rate (per 100,000) = 193
Sex-specific rates:
Female = 306.5
Male = 73.0
Race specific rates:
African American = 1,008.3
White = 88.4
While Chlamydia trachomatis has been known to cause sexually transmitted genital infections for a number of years, only recently have economical and practical diagnostic methods been available to the physician. This enables the clinician to appropriately identify and treat patients, and has led to more accurate reporting of the disease. Morbidity increased by 13% from 1997 to 1998 (9,292 vs. 11,267). This increase was due in large part to screening of young females at high risk of infection through the federally funded efforts of the Indiana STD Program and the Indiana Family Health Council
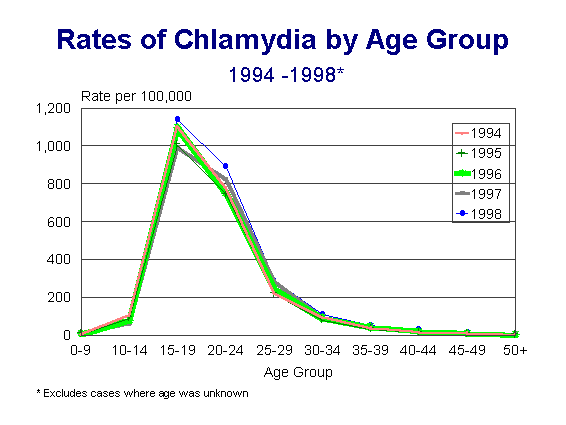
Figure 5 summarizes age specific rates for chlamydia infection for 1994-1998. The graph demonstrates the highest rate of chlamydia for the past five years was in the 15-19 and 20-24 year age groups.
Figure 5.
There is a higher reported rate of chlamydia infection in females; however, these data must be interpreted with caution because chlamydia screening programs preferentially test females. Chlamydia infection in males is often diagnosed as non-gonococcal urethritis, which is not reportable. This led to an underestimation of chlamydia morbidity in males.
[an error occurred while processing this directive]