Public Provider Immunization Assessments in Indiana
2001 Assessment Results
Public Provider Reports |
Immunization Index | Data
and Statistics
Previous Page |
Contents | Next Page
Summary Tables and Graphs
(continued)
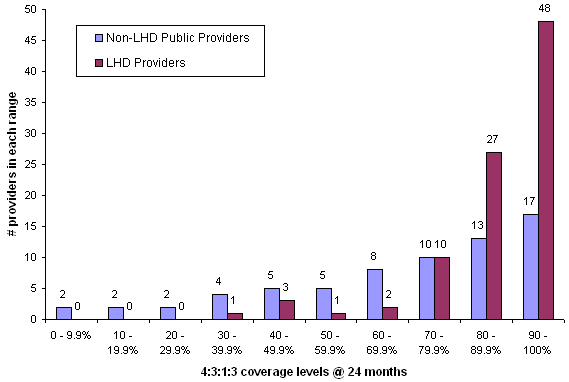 |
Figure 2: 4 DTaP: 3 Polio: 1 MMR: 3 Hib
immunization series coverage levels at 24 months of age by provider type,
non-local health departments (n=68) and local health departments (n=92),
in Indiana for 2001.
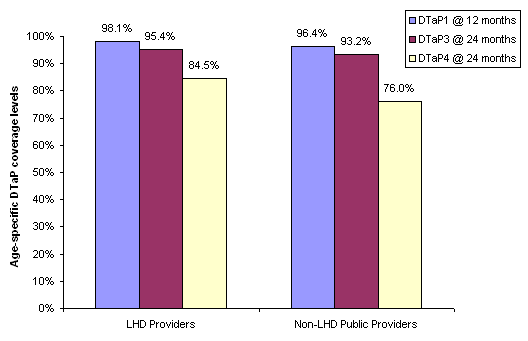 |
Figure 3: Mean coverage levels of
successive DTaP vaccinations, by provider type in Indiana for 2001.
Public Provider Reports | Immunization Index |
Data
and Statistics
Previous Page |
Contents | Next Page