School Reports |
Immunization Index | Data
and Statistics
University
Immunization Rates in Indiana
2002 Assessment Results
Immunization Program
Indiana State Department of Health
2 N Meridian Street
Indianapolis, IN 46204
Publication Date: 06/2002

Indiana State Department of Health
Gregory A. Wilson, M.D., State Health Commissioner
Michael Hurst, J.D., Deputy State Health Commissioner
Community and Family Health Services Commission
Wendy Gettelfinger, R.N., D.N.S., J.D., Assistant Commissioner
Immunization Program
Michael Runau, M.S., Program Director
Charlene Graves, M.D., Medical Director
Primary Author
Sandra Beck, M.P.H., Epidemiologist
The Indiana State Department of Health gratefully acknowledges the efforts
of the university staff members who had the major task of implementing
this law at their respective institutions.
Preface
In 1993, the Indiana General Assembly enacted legislation,
implemented in 1995 (IC 20-12-71), requiring new full-time students
attending classes at a residential public postsecondary institution
to document immunity against five diseases preventable by vaccination.
As a result of this law, six universities (Ball State University, Indiana
State University, Indiana University, Purdue University, the University
of Southern Indiana, and Vincennes University) require matriculating
students to document proof of immunity to measles, mumps, rubella, tetanus,
and diphtheria. The law requires the universities to designate a record-keeping
office who will maintain records on all full-time matriculating students
and identify those students who are exempt from providing proof of immunity
for religious or medical reasons. Students are to be denied second
semester enrollment if they do not provide the proper documentation
of immunity. The six universities are also required to submit individual
reports, indicating the immune status of their students, to the Indiana
State Department of Health on an annual basis. The present report, “University
Immunization Rates in Indiana” prepared by the Indiana State Department
of Health, summarizes the data received from the universities for the
2001-2002 school year.
Summary Tables and Graphs
- Table 1. Combined-student university immunization
report
- Table 2. Percent of students in compliance with
law, by school
- Figure 1. Percent of students in compliance with
law, previous four years
- Figure 2. Percent of students completely vaccinated,
previous four years
Individual University Reports
- Table 3. Ball State University: 2001 - 2002 Results
- Figure 3. Ball State University: Percent of students
completely vaccinated, 1998-2002
- Table 4. Indiana State University: 2001 - 2002 Results
- Figure 4. Indiana State University: Percent of
students completely vaccinated, 1998 - 2002
- Table 5. Indiana University - Bloomington: 2001
- 2002 Results
- Figure 5. Indiana University - Bloomington: Percent
of students completely vaccinated, 1998 - 2002
- Table 6. Purdue University - West Lafayette: 2001
- 2002 Results
- Figure 6. Purdue University - West Lafayette:
Percent of students completely vaccinated, 1998 - 2002
- Table 7. University of Southern Indiana: 2001 -
2002 Results
- Figure 7. University of Southern Indiana: Percent
of students completely vaccinated, 1998 - 2002
- Table 8. Vincennes University: 2001 - 2002 Results
- Figure 8. Vincennes University: Percent of students
completely vaccinated, 1998 - 2002
Table 1. Immunization report for all six Indiana
universities (combined) covered by state law (IC 20-12-71), 2001-2002 school
year. (Total number of students: 29,251)
| |
Measles
(%) |
Mumps
(%) |
Rubella
(%) |
Tetanus
(%) |
Diphtheria
(%) |
| Number of Students with Complete Vaccine Record |
28248
(96.6) |
28475
(97.3) |
28507
(97.5) |
24091
(82.4) |
24073
(82.3) |
| Number of Students with Disease History |
66 |
60 |
|
0 |
2 |
| Number of Students with Documented Laboratory Immunity |
113 |
80 |
109 |
0 |
0 |
| Number of Students Born Before January 1, 1957 |
128 |
128 |
127 |
|
|
| Number of Students with Medical Exemptions |
33 |
18 |
17 |
28 |
29 |
| Number of Students with Religious Exemptions |
42 |
42 |
42 |
40 |
40 |
| Number of Students with temporary exemption due to Td
shortage |
|
|
|
4118 |
4123 |
| Total Number of Students in Compliance* |
28630
(97.9) |
28803
(98.5) |
28802
(98.5) |
28277
(96.7) |
28267
(96.6) |
Total Number of Students Who Received a Notice of Exclusion
from Second Semester Enrollment
for Failure to Comply with Immunization Policy:2153 (7.4%)
Table 2. Percent of university students in compliance*
with Indiana immunization law, 2001-2002 school year.
| University |
Students
Covered |
Measles |
Mumps |
Rubella |
Tetanus/Diphtheria |
| Ball State University |
3569 |
98.7% |
99.5% |
98.9% |
99.9% |
| Indiana State University |
2420 |
94.7% |
95.8% |
95.7% |
64.7% |
| Indiana University - Bloomington |
9281 |
99.0% |
99.2% |
99.2% |
100.0% |
| Purdue University - West Lafayette |
8500 |
97.0% |
97.9% |
98.0% |
99.7% |
| University of Southern Indiana |
3243 |
100.6% |
100.5% |
100.6% |
100.1% |
| Vincennes University |
2238 |
95.2% |
95.8% |
96.3% |
95.7% |
| TOTALS |
29251 |
97.9% |
98.5% |
98.5% |
96.7% |
* Some students may have been included in more than one compliance
category.
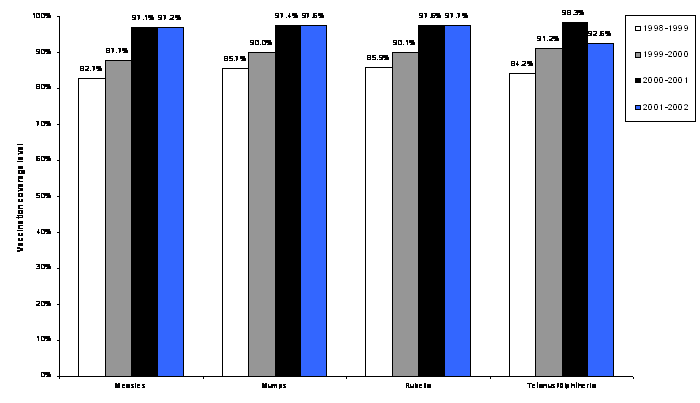
Figure 1. Percent of students in compliance
with Indiana state law,
for all six universities, previous four school years.
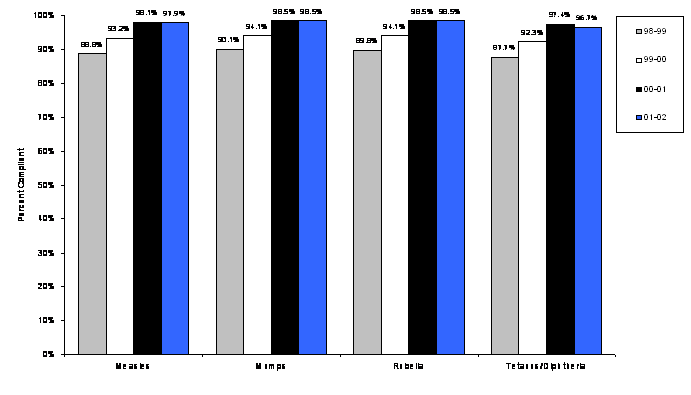
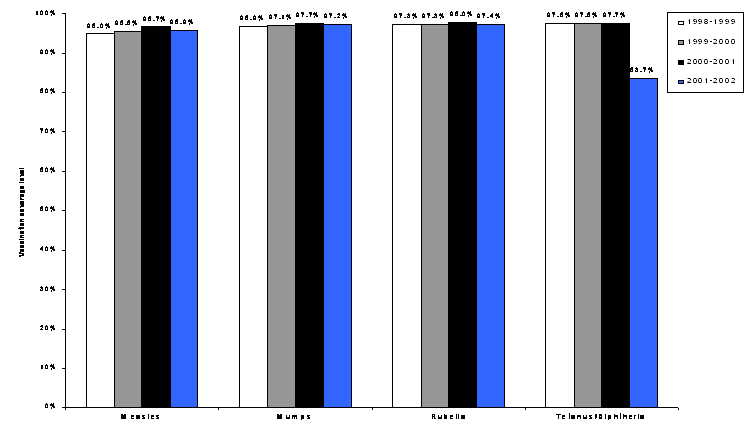
Figure 2. Percent of students completely vaccinated, for
all six universities, previous four school years.
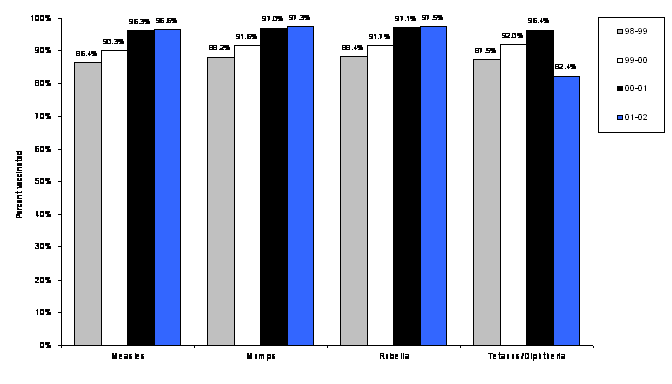
Table 3. Ball State University, 2001-2002 school
year. (Total number of students included=3569)
| |
Measles
(%) |
Mumps
(%) |
Rubella
(%) |
Tetanus
(%) |
Diphtheria
(%) |
| Number of Students with Complete Vaccine Record |
3503 |
3503 |
3503 |
2577 |
2577 |
| Number of Students with Disease History |
0 |
17 |
|
0 |
0 |
| Number of Students with Documented Laboratory Immunity |
9 |
21 |
15 |
0 |
0 |
| Number of Students Born Before January 1, 1957 |
5 |
5 |
5 |
|
|
| Number of Students with Medical Exemptions |
2 |
2 |
2 |
3 |
3 |
| Number of Students with Religious Exemptions |
3 |
3 |
3 |
3 |
3 |
| Number of Students with temporary exemption due to Td
shortage |
|
|
|
981 |
981 |
| Total Number of Students in Compliance* |
3522 |
3551 |
3528 |
3564 |
3564 |
Total Number of Students Who Received a Notice of Exclusion
from Second Semester Enrollment
for Failure to Comply with Immunization Policy:15 (0.4%)
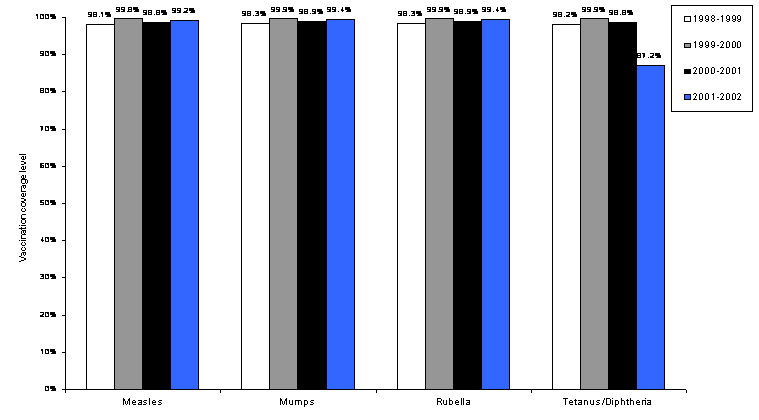
Figure 3. Ball State University. Percent
of students completely vaccinated, previous four school years.
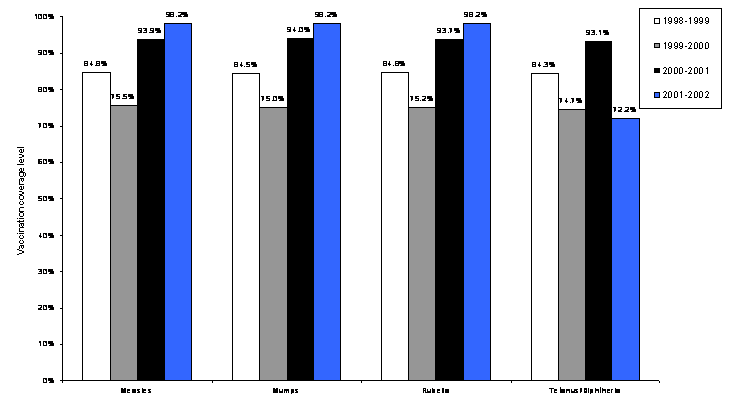
* Some students may have been included in more than one compliance category.
Table 4. Indiana State University, 2001-2002 school
year. (Total number of students included=2420)
| |
Measles
(%) |
Mumps
(%) |
Rubella
(%) |
Tetanus
(%) |
Diphtheria
(%) |
| Number of Students with Complete Vaccine Record |
2259 |
2298 |
2301 |
1568 |
1564 |
| Number of Students with Disease History |
6 |
4 |
|
0 |
0 |
| Number of Students with Documented Laboratory Immunity |
11 |
5 |
5 |
0 |
0 |
| Number of Students Born Before January 1, 1957 |
11 |
11 |
11 |
|
|
| Number of Students with Medical Exemptions |
4 |
0 |
0 |
0 |
0 |
| Number of Students with Religious Exemptions |
0 |
0 |
0 |
0 |
0 |
| Number of Students with temporary exemption due to Td
shortage |
|
|
|
0 |
0 |
| Total Number of Students in Compliance* |
2291 |
2318 |
2317 |
1568 |
1564 |
Total Number of Students Who Received a Notice of Exclusion
from Second Semester Enrollment
for Failure to Comply with Immunization Policy:(Not Reported)
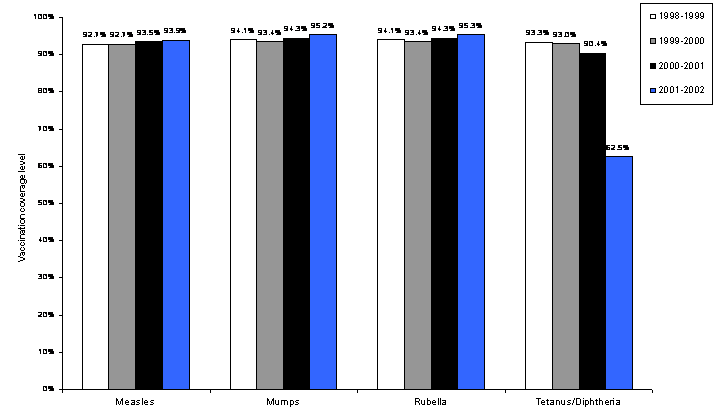
Figure 4. Indiana State University. Percent
of students completely vaccinated, previous four school years.
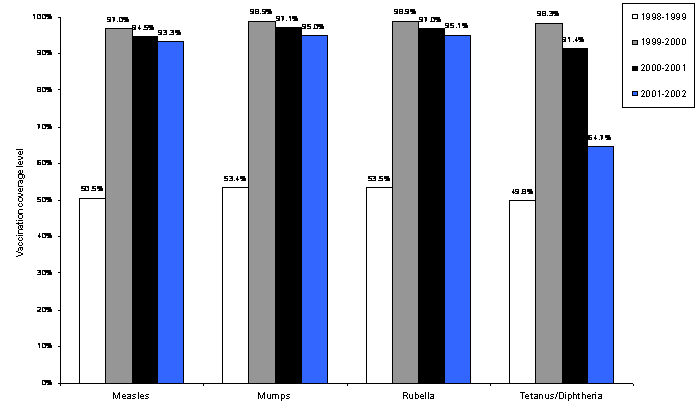
* Some students may have been included in more than one compliance category.
Table 5. Indiana University - Bloomington, 2001-2002
school year. (Total number of students included=9281)
| |
Measles
(%) |
Mumps
(%) |
Rubella
(%) |
Tetanus
(%) |
Diphtheria
(%) |
| Number of Students with Complete Vaccine Record |
9017 |
9055 |
9068 |
8598 |
8598 |
| Number of Students with Disease History |
21 |
19 |
|
0 |
0 |
| Number of Students with Documented Laboratory Immunity |
43 |
32 |
42 |
0 |
0 |
| Number of Students Born Before January 1, 1957 |
80 |
80 |
80 |
|
|
| Number of Students with Medical Exemptions |
7 |
6 |
5 |
1 |
1 |
| Number of Students with Religious Exemptions |
16 |
16 |
16 |
16 |
16 |
| Number of Students with temporary exemption due to Td
shortage |
|
|
|
666 |
666 |
| Total Number of Students in Compliance* |
9184 |
9208 |
9211 |
9281 |
9281 |
Total Number of Students Who Received a Notice of Exclusion
from Second Semester Enrollment
for Failure to Comply with Immunization Policy:123 (1.3%)
Figure 5. Indiana University
- Bloomington. Percent of students completely vaccinated, previous four school
years.
* Some students may have been included in more than one compliance
category.
Table 6. Purdue University, 2001-2002 school
year. (Total number of students included=8500)
| |
Measles
(%) |
Mumps
(%) |
Rubella
(%) |
Tetanus
(%) |
Diphtheria
(%) |
| Number of Students with Complete Vaccine Record |
8152 |
8265 |
8279 |
7115 |
7115 |
| Number of Students with Disease History |
27 |
17 |
|
0 |
0 |
| Number of Students with Documented Laboratory Immunity |
35 |
17 |
24 |
0 |
0 |
| Number of Students Born Before January 1, 1957 |
7 |
7 |
7 |
|
|
| Number of Students with Medical Exemptions |
5 |
2 |
2 |
4 |
4 |
| Number of Students with Religious Exemptions |
15 |
15 |
15 |
13 |
13 |
| Number of Students with temporary exemption due to Td
shortage |
|
|
|
1344 |
1344 |
| Total Number of Students in Compliance |
8241 |
8323 |
8327 |
8476 |
8476 |
Total Number of Students Who Received a Notice of Exclusion
from Second Semester Enrollment
for Failure to Comply with Immunization Policy:1918 (22.6%)
Figure 6. Purdue University. Percent
of students completely vaccinated, previous four school years.
* Some students may have been included in more than one compliance category.
Table 7. University of Southern Indiana, 2001-2002
school year. (Total number of students included=3243)
| |
Measles
(%) |
Mumps
(%) |
Rubella
(%) |
Tetanus
(%) |
Diphtheria
(%) |
| Number of Students with Complete Vaccine Record |
3216 |
3224 |
3224 |
2831 |
2825 |
| Number of Students with Disease History |
4 |
3 |
|
0 |
2 |
| Number of Students with Documented Laboratory Immunity |
7 |
5 |
13 |
0 |
0 |
| Number of Students Born Before January 1, 1957 |
19 |
19 |
18 |
|
|
| Number of Students with Medical Exemptions |
10 |
3 |
3 |
15 |
16 |
| Number of Students with Religious Exemptions |
5 |
5 |
5 |
5 |
5 |
| Number of Students with temporary exemption due to Td
shortage |
|
|
|
392 |
397 |
| Total Number of Students in Compliance* |
3261 |
3259 |
3263 |
3243 |
3245 |
Total Number of Students Who Received a Notice of Exclusion
from Second Semester Enrollment
for Failure to Comply with Immunization Policy:0 (0.0%)
Figure 7. University of Southern Indiana.
Percent of students completely vaccinated, previous four school years.
*Some students may have been included in more than one compliance category.
Table 8. Vincennes University, 2001-2002 school
year. (Total number of students included=2238)
|
Measles
(%) |
Mumps
(%) |
Rubella
(%) |
Tetanus
(%) |
Diphtheria
(%) |
| Number of Students with Complete Vaccine Record |
2101 |
2130 |
2132 |
1402 |
1394 |
| Number of Students with Disease History |
8 |
0 |
|
0 |
0 |
| Number of Students with Documented Laboratory Immunity |
8 |
0 |
10 |
0 |
0 |
| Number of Students Born Before January 1, 1957 |
6 |
6 |
6 |
|
|
| Number of Students with Medical Exemptions |
5 |
5 |
5 |
5 |
5 |
| Number of Students with Religious Exemptions |
3 |
3 |
3 |
3 |
3 |
| Number of Students with temporary exemption due to Td
shortage |
|
|
|
735 |
735 |
| Total Number of Students in Compliance* |
2131 |
2144 |
2156 |
2145 |
2137 |
Total Number of Students Who Received a Notice of Exclusion
from Second Semester Enrollment
for Failure to Comply with Immunization Policy:97 (4.3%)
Figure 8. Vincennes University. Percent
of students completely vaccinated, previous four school years.
*Some students may have been included in more than one compliance category.
School Reports |
Immunization Index | Data
and Statistics