Table of Contents
Section 3-2: Female Breast
Section 3-4: Colon
Table 3.3-1: Comparison of Incidence Rates by Race
Table 3.3-2: Comparison of Mortality Rates by Race
Table 3.3-3: Comparison of State and Regional Incidence Rates
Table 3.3-4: Comparison of State and Regional Mortality Rates
Table 3.3-5: Age-Specific Incidence Rates by Sex and Race
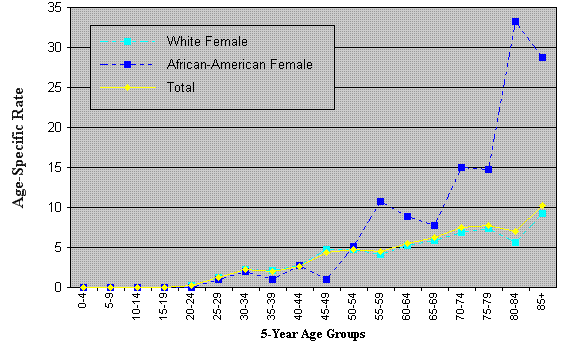
Table 3.3-6: Age-Specific Mortality Rates by Sex and Race (below)
Table 3.3-7: Stage at Diagnosis
| Age at Diagnosis | White Female | African-American Female | Total | |||
|---|---|---|---|---|---|---|
| Number | Rate | Number | Rate | Number | Rate | |
| 0-4 | 0 | 0.0 | 0 | 0.0 | 0 | 0.0 |
| 5-9 | 0 | 0.0 | 0 | 0.0 | 0 | 0.0 |
| 10-14 | 0 | 0.0 | 0 | 0.0 | 0 | 0.0 |
| 15-19 | 0 | 0.0 | 0 | 0.0 | 0 | 0.0 |
| 20-24 | 2 | 0.2 | 0 | 0.0 | 2 | 0.2 |
| 25-29 | 11 | 1.3 | 1 | 1.0 | 12 | 1.2 |
| 30-34 | 20 | 2.2 | 2 | 2.0 | 23 | 2.2 |
| 35-39 | 21 | 2.1 | 1 | 1.0 | 22 | 2.0 |
| 40-44 | 29 | 2.7 | 3 | 2.8 | 32 | 2.6 |
| 45-49 | 49 | 4.7 | 1 | 1.0 | 50 | 4.4 |
| 50-54 | 44 | 4.8 | 4 | 5.1 | 48 | 4.7 |
| 55-59 | 31 | 4.1 | 6 | 10.8 | 37 | 4.5 |
| 60-64 | 32 | 5.3 | 4 | 8.9 | 36 | 5.5 |
| 65-69 | 30 | 5.9 | 3 | 7.7 | 34 | 6.2 |
| 70-74 | 33 | 6.9 | 5 | 15.0 | 39 | 7.5 |
| 75-79 | 33 | 7.4 | 4 | 14.8 | 37 | 7.8 |
| 80-84 | 19 | 5.6 | 6 | 33.2 | 25 | 7.0 |
| 85+ | 31 | 9.3 | 5 | 28.7 | 36 | 10.2 |

Table of Contents
Section 3-2: Female Breast
Section 3-4: Colon