Table of Contents
Section 3-1: All Sites
Section 3-3: Cervix
Table 3.2-1: Comparison of Incidence Rates by Race
Table 3.2-2: Comparison of Mortality Rates by Race
Table 3.2-3: Comparison of State and Regional Incidence Rates
Table 3.2-4: Comparison of State and Regional Mortality Rates
Table 3.2-5: Age-Specific Incidence Rates by Sex and Race
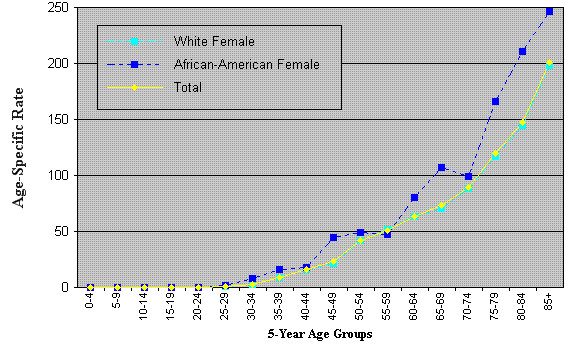
Table 3.2-6: Age-Specific Mortality Rates by Sex and Race (below)
Table 3.2-7: Stage at Diagnosis
| Age at Diagnosis | White Female | African-American Female | Total | |||
|---|---|---|---|---|---|---|
| Number | Rate | Number | Rate | Number | Rate | |
| 0-4 | 0 | 0.0 | 0 | 0.0 | 0 | 0.0 |
| 5-9 | 0 | 0.0 | 0 | 0.0 | 0 | 0.0 |
| 10-14 | 0 | 0.0 | 0 | 0.0 | 0 | 0.0 |
| 15-19 | 0 | 0.0 | 0 | 0.0 | 0 | 0.0 |
| 20-24 | 1 | 0.1 | 0 | 0.0 | 1 | 0.1 |
| 25-29 | 7 | 0.8 | 2 | 1.9 | 9 | 0.9 |
| 30-34 | 23 | 2.5 | 8 | 7.9 | 31 | 3.0 |
| 35-39 | 86 | 8.6 | 16 | 15.8 | 103 | 9.2 |
| 40-44 | 171 | 15.7 | 19 | 17.9 | 191 | 15.8 |
| 45-49 | 222 | 21.5 | 43 | 45.0 | 267 | 23.3 |
| 50-54 | 387 | 41.8 | 38 | 48.7 | 428 | 42.1 |
| 55-59 | 386 | 51.5 | 26 | 46.9 | 416 | 51.0 |
| 60-64 | 379 | 63.3 | 36 | 80.5 | 415 | 63.8 |
| 65-69 | 358 | 70.4 | 42 | 107.3 | 402 | 72.8 |
| 70-74 | 426 | 88.5 | 33 | 99.2 | 464 | 89.6 |
| 75-79 | 526 | 117.3 | 45 | 166.3 | 571 | 119.6 |
| 80-84 | 488 | 144.2 | 38 | 210.4 | 528 | 147.7 |
| 85+ | 662 | 198.3 | 43 | 246.4 | 707 | 200.7 |
