Table of Contents
Section 3-3: Cervix
Section 3-5: Lung
Table 3.4-1: Comparison of Incidence Rates by Race
Table 3.4-2: Comparison of Mortality Rates by Race
Table 3.4-3: Comparison of State and Regional Incidence Rates
Table 3.4-4: Comparison of State and Regional Mortality Rates
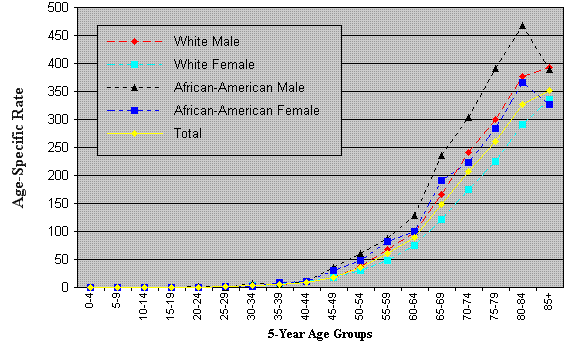
Table 3.4-5: Age-Specific Incidence Rates by Sex and Race (below)
Table 3.4-6: Age-Specific Mortality Rates by Sex and Race
Table 3.4-7: Stage at Diagnosis
| Age at Diagnosis | White Male | White Female | African-American Male | African-American Female | Total | |||||
|---|---|---|---|---|---|---|---|---|---|---|
| Number | Rate | Number | Rate | Number | Rate | Number | Rate | Number | Rate | |
| 0-4 | 0 | 0.0 | 0 | 0.0 | 0 | 0.0 | 0 | 0.0 | 0 | 0.0 |
| 5-9 | 0 | 0.0 | 0 | 0.0 | 0 | 0.0 | 0 | 0.0 | 0 | 0.0 |
| 10-14 | 1 | 0.1 | 0 | 0.0 | 0 | 0.0 | 0 | 0.0 | 1 | 0.0 |
| 15-19 | 1 | 0.1 | 2 | 0.2 | 0 | 0.0 | 0 | 0.0 | 3 | 0.1 |
| 20-24 | 7 | 0.7 | 5 | 0.5 | 1 | 0.9 | 0 | 0.0 | 13 | 0.6 |
| 25-29 | 9 | 1.0 | 9 | 1.1 | 0 | 0.0 | 1 | 1.0 | 19 | 1.0 |
| 30-34 | 26 | 2.8 | 31 | 3.4 | 6 | 6.5 | 2 | 2.0 | 67 | 3.2 |
| 35-39 | 60 | 5.9 | 47 | 4.7 | 5 | 5.5 | 9 | 8.9 | 124 | 5.5 |
| 40-44 | 92 | 8.5 | 110 | 10.1 | 10 | 10.6 | 12 | 11.3 | 228 | 9.5 |
| 45-49 | 178 | 17.2 | 181 | 17.5 | 29 | 35.0 | 29 | 30.4 | 426 | 18.7 |
| 50-54 | 346 | 38.0 | 279 | 30.1 | 40 | 60.1 | 37 | 47.4 | 710 | 35.4 |
| 55-59 | 487 | 67.7 | 368 | 49.1 | 41 | 86.9 | 46 | 83.0 | 961 | 60.4 |
| 60-64 | 548 | 98.4 | 452 | 75.4 | 47 | 128.0 | 45 | 100.6 | 1,107 | 88.6 |
| 65-69 | 739 | 166.4 | 622 | 122.3 | 69 | 236.0 | 75 | 191.7 | 1,517 | 147.4 |
| 70-74 | 897 | 241.4 | 843 | 175.2 | 71 | 303.1 | 74 | 222.5 | 1,901 | 207.7 |
| 75-79 | 927 | 300.0 | 1,006 | 224.4 | 70 | 390.8 | 77 | 284.5 | 2,098 | 260.4 |
| 80-84 | 727 | 376.5 | 987 | 291.7 | 47 | 468.4 | 66 | 365.5 | 1,836 | 327.1 |
| 85+ | 519 | 392.3 | 1,119 | 335.2 | 28 | 389.6 | 57 | 326.7 | 1,736 | 352.6 |
