Table of Contents
Section 3-4: Colon
Section 3-6: Prostate
Table 3.5-1: Comparison of Incidence Rates by Race
Table 3.5-2: Comparison of Mortality Rates by Race
Table 3.5-3: Comparison of State and Regional Incidence Rates
Table 3.5-4: Comparison of State and Regional Mortality Rates
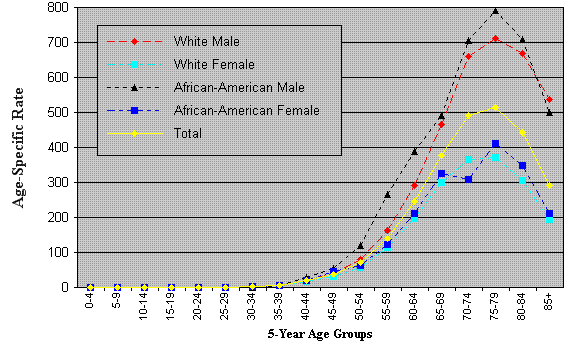
Table 3.5-5: Age-Specific Incidence Rates by Sex and Race (below)
Table 3.5-6: Age-Specific Mortality Rates by Sex and Race
Table 3.5-7: Stage at Diagnosis
| Age at Diagnosis | White Male | White Female | African-American Male | African-American Female | Total | |||||
|---|---|---|---|---|---|---|---|---|---|---|
| Number | Rate | Number | Rate | Number | Rate | Number | Rate | Number | Rate | |
| 0-4 | 0 | 0.0 | 1 | 0.1 | 0 | 0.0 | 0 | 0.0 | 1 | 0.0 |
| 5-9 | 0 | 0.0 | 0 | 0.0 | 0 | 0.0 | 0 | 0.0 | 0 | 0.0 |
| 10-14 | 1 | 0.1 | 1 | 0.1 | 0 | 0.0 | 0 | 0.0 | 2 | 0.1 |
| 15-19 | 0 | 0.0 | 6 | 0.6 | 0 | 0.0 | 0 | 0.0 | 6 | 0.3 |
| 20-24 | 2 | 0.2 | 4 | 0.4 | 0 | 0.0 | 0 | 0.0 | 6 | 0.3 |
| 25-29 | 3 | 0.3 | 7 | 0.8 | 1 | 1.0 | 0 | 0.0 | 11 | 0.6 |
| 30-34 | 19 | 2.0 | 19 | 2.1 | 0 | 0.0 | 2 | 2.0 | 41 | 2.0 |
| 35-39 | 56 | 5.5 | 63 | 6.3 | 4 | 4.4 | 6 | 5.9 | 131 | 5.8 |
| 40-44 | 215 | 19.8 | 194 | 17.8 | 26 | 27.5 | 20 | 18.8 | 456 | 18.9 |
| 45-49 | 401 | 38.7 | 338 | 32.8 | 46 | 55.5 | 45 | 47.1 | 836 | 36.7 |
| 50-54 | 729 | 80.2 | 538 | 58.1 | 80 | 120.2 | 50 | 64.0 | 1,410 | 70.3 |
| 55-59 | 1,175 | 163.3 | 854 | 113.9 | 125 | 264.8 | 68 | 122.7 | 2,235 | 140.6 |
| 60-64 | 1,625 | 291.9 | 1,187 | 198.1 | 143 | 389.3 | 95 | 212.4 | 3,065 | 245.3 |
| 65-69 | 2,067 | 465.3 | 1,524 | 299.7 | 144 | 492.4 | 127 | 324.6 | 3,896 | 378.5 |
| 70-74 | 2,448 | 658.7 | 1,757 | 365.1 | 165 | 704.5 | 103 | 309.8 | 4,507 | 492.5 |
| 75-79 | 2,199 | 711.7 | 1,662 | 370.7 | 142 | 792.8 | 111 | 410.1 | 4,143 | 514.1 |
| 80-84 | 1,293 | 669.6 | 1,037 | 306.5 | 71 | 707.5 | 63 | 348.9 | 2,479 | 441.6 |
| 85+ | 710 | 536.6 | 646 | 193.5 | 36 | 501.0 | 37 | 212.0 | 1,441 | 292.7 |
