Program Overview
Indiana has hundreds of public lakes. Most in northern Indiana were naturally formed, while most in central and southern Indiana are man-made. These lakes are ecologically valuable resources that provide habitat for many species and abundant recreational opportunities.
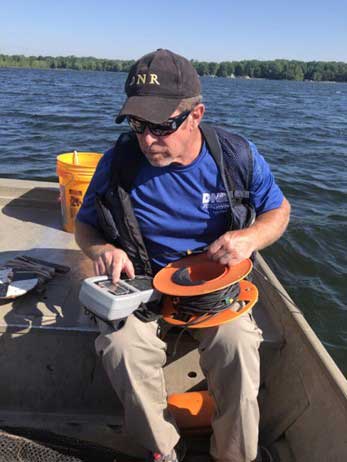
The goal of the DNR Status & Trends Program is to provide a study design that accurately describes the current condition of Indiana lakes and monitors changes over time. Evaluations of native fish communities, habitat, and water quality form the foundation of the program. Dissolved oxygen and water temperature profiles are completed each summer to quantify warm, cool, and coldwater habitat availability. Cool and coldwater habitat are necessary for native species such as Northern pike and Cisco to thrive in lakes. Aquatic vegetation is assessed using standardized vegetation surveys and hydroacoustic mapping.
Fish Community
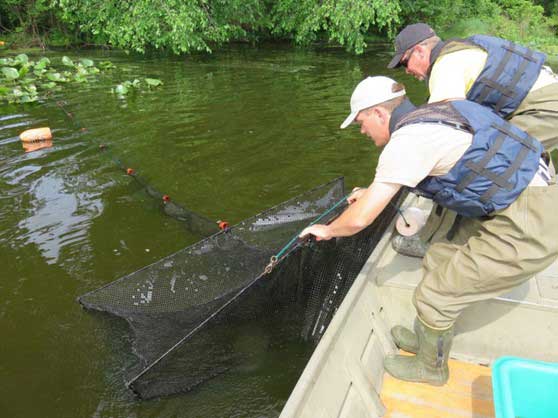
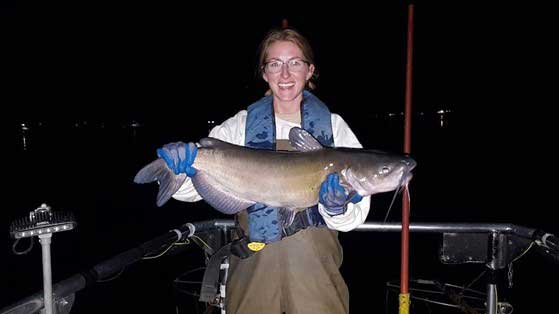
Standardized fish community surveys are completed each May and June using a randomized sampling schedule. Fisheries biologists collect fish using trap nets, gill nets, and nighttime electrofishing. All three pieces of equipment allow fish biologist to collect a variety of fish species to assess the composition of fish communities.
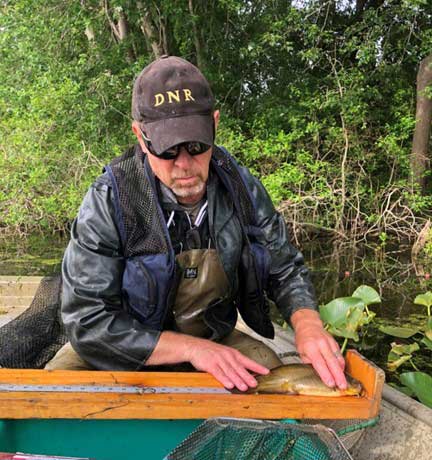
Captured fish are identified and measured and are then immediately returned to the lake. The long-term commitment to these fish community surveys provides fisheries biologists with the information necessary to detect changes to native fish communities over time. This includes changes to ecologically important native species, such as Northern pike, cisco, white sucker, lake chubsucker, bowfin, and many others. Since 2010, biologists have completed fish community surveys at hundreds of natural lakes (i.e., glacial lakes) and man-made lakes (i.e., reservoirs). The results of these fish community survey results are available using the interactive dashboard below.
- How to use this interactive dashboard
- At the top of the page are three green buttons that can be used to toggle among fish community survey results for glacial lakes species, reservoir species, or individual lake species survey results.
- Click the “Reset All Filters” button to clear all filters and bring the dashboard back to the original view.
- The display of this page has been tested with various devices, screen sizes, and web browsers. Even with this testing, there may be display issues with some specific devices and browsers.
Searching results for glacial lakes or reservoirs
- Use the drop-down filter to select your species of interest.
- When you search for the result for individual species across all surveys, the dashboard will display the name of the species selected, the total number of fish of that species that have been captured, the percentage (%) of lakes that species has been detected in, a map of the location of lakes where the species has been detected, a table containing the number of individuals of that species that were observed at each lake, and a figure displaying the length distribution (in inches) for the selected species. The dashboard also allows you to select individual length ranges from the length frequency graph, which will then display the lakes where fish of the selected sizes were observed.
Searching for individual lake survey results
- Use the drop-down to select the lake of interest.
- When you search for the result for surveys by individual lake, the dashboard will display the name of the selected lake, the county, the year the survey was completed, the total number of fish collected in the survey and a map with the location of the lake, and a table will display the fish species that were collected during the survey. The number of fish collected for each species will also be displayed in the table. If interested in a specific species, you may select that species name from the drop-down below the map. The length frequency distribution (in inches) for that selected species will be displayed in a graph.
- How to interpret survey results
- Status & Trends fish community surveys for glacial lakes are completed in June using standardized effort, so lake-specific catches are directly comparable to each other.
- Status & Trends fish community surveys for reservoirs are completed in May and receive variable amounts of sampling effort based on the surface acreage of the body of water. Because variable amounts of effort are performed at reservoirs, users should review the sampling effort for surveys when comparing catches of different lakes. The amount of sampling effort conducted for each survey can be viewed by hovering over “More Info.”