Table of Contents
Section 3-1: All Sites
Section 3-3: Cervix
Table 3.2-1: Comparison of Incidence Rates by Race
Table 3.2-2: Comparison of Mortality Rates by Race
Table 3.2-3: Comparison of State and Regional Incidence Rates
Table 3.2-4: Comparison of State and Regional Mortality Rates
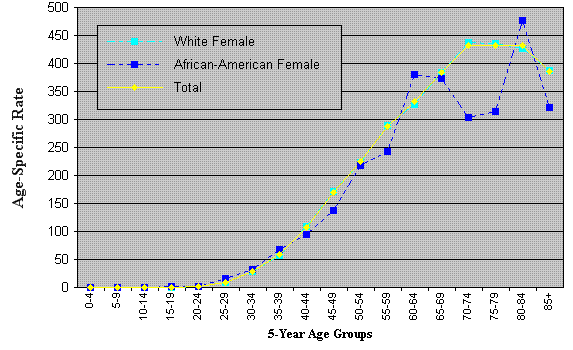
Table 3.2-5: Age-Specific Incidence Rates by Sex and Race (below)
Table 3.2-6: Age-Specific Mortality Rates by Sex and Race
Table 3.2-7: Stage at Diagnosis
| Age at Diagnosis | White Female | African-American Female | Total | |||
|---|---|---|---|---|---|---|
| Number | Rate | Number | Rate | Number | Rate | |
| 0-4 | 0 | 0.0 | 0 | 0.0 | 0 | 0.0 |
| 5-9 | 1 | 0.1 | 0 | 0.0 | 1 | 0.1 |
| 10-14 | 0 | 0.0 | 0 | 0.0 | 0 | 0.0 |
| 15-19 | 2 | 0.2 | 1 | 0.9 | 3 | 0.3 |
| 20-24 | 13 | 1.3 | 2 | 1.7 | 16 | 1.4 |
| 25-29 | 74 | 8.7 | 16 | 15.4 | 91 | 9.3 |
| 30-34 | 258 | 28.3 | 32 | 31.6 | 300 | 28.9 |
| 35-39 | 575 | 57.4 | 68 | 67.3 | 656 | 58.4 |
| 40-44 | 1,187 | 109.1 | 100 | 94.1 | 1,310 | 108.0 |
| 45-49 | 1,771 | 171.6 | 131 | 137.1 | 1,934 | 169.1 |
| 50-54 | 2,064 | 223.0 | 170 | 217.7 | 2,282 | 224.2 |
| 55-59 | 2,172 | 289.6 | 135 | 243.6 | 2,344 | 287.6 |
| 60-64 | 1,958 | 326.8 | 170 | 380.1 | 2,157 | 331.8 |
| 65-69 | 1,950 | 383.5 | 146 | 373.1 | 2,119 | 383.9 |
| 70-74 | 2,105 | 437.4 | 101 | 303.8 | 2,234 | 431.4 |
| 75-79 | 1,954 | 435.9 | 85 | 314.1 | 2,062 | 431.9 |
| 80-84 | 1,444 | 426.8 | 86 | 476.2 | 1,544 | 431.9 |
| 85+ | 1,293 | 387.3 | 56 | 320.9 | 1,357 | 385.1 |
