Table of Contents
Section 3-4: Colon
Section 3-6: Prostate
Table 3.5-1: Comparison of Incidence Rates by Race
Table 3.5-2: Comparison of Mortality Rates by Race
Table 3.5-3: Comparison of State and Regional Incidence Rates
Table 3.5-4: Comparison of State and Regional Mortality Rates
Table 3.5-5: Age-Specific Incidence Rates by Sex and Race
Table 3.5-6: Age-Specific Mortality Rates by Sex and Race
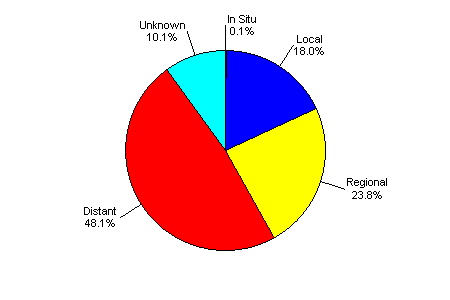
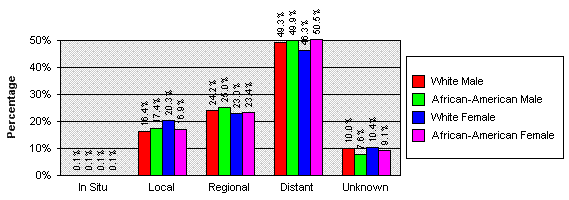
Table 3.5-7: Stage at Diagnosis (below)
| Total | In Situ | Local | Regional | Distant | Unknown | |
|---|---|---|---|---|---|---|
| White Male Percent |
12,954 100.0% |
11 0.1% |
2,122 16.4% |
3,139 24.2% |
6,383 49.3% |
1,299 10.0% |
| White Female Percent |
9,845 100.0% |
6 0.1% |
1,994 20.3% |
2,264 23.0% |
4,558 46.3% |
1,023 10.4% |
| African-American Male Percent |
984 100.0% |
1 0.1% |
171 17.4% |
246 25.0% |
491 49.9% |
75 7.6% |
| African-American Female Percent |
728 100.0% |
1 0.1% |
123 16.9% |
170 23.4% |
368 50.5% |
66 9.1% |
| Total All Races and Sexes Percent |
24,687 100.0% |
20 0.1% |
4,438 18.0% |
5,864 23.8% |
11,875 48.1% |
2,490 10.1% |

