Table of Contents
Section 3-4: Colon
Section 3-6: Prostate
Table 3.5-1: Comparison of Incidence Rates by Race
Table 3.5-2: Comparison of Mortality Rates by Race
Table 3.5-3: Comparison of State and Regional Incidence Rates
Table 3.5-4: Comparison of State and Regional Mortality Rates
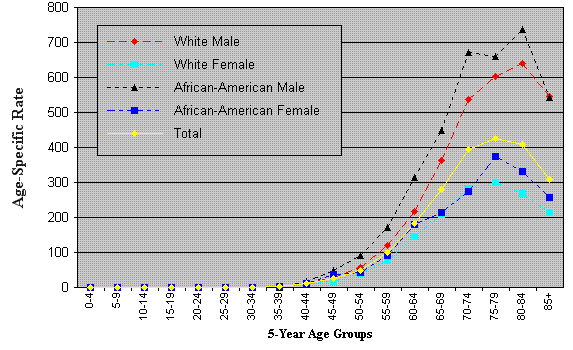
Table 3.5-5: Age-Specific Incidence Rates by Sex and Race
Table 3.5-6: Age-Specific Mortality Rates by Sex and Race (below)
Table 3.5-7: Stage at Diagnosis
| Age at Diagnosis | White Male | White Female | African-American Male | African-American Female | Total | |||||
|---|---|---|---|---|---|---|---|---|---|---|
| Number | Rate | Number | Rate | Number | Rate | Number | Rate | Number | Rate | |
| 0-4 | 0 | 0.0 | 1 | 0.1 | 0 | 0.0 | 0 | 0.0 | 1 | 0.0 |
| 5-9 | 1 | 0.1 | 0 | 0.0 | 0 | 0.0 | 0 | 0.0 | 1 | 0.0 |
| 10-14 | 1 | 0.1 | 0 | 0.0 | 0 | 0.0 | 0 | 0.0 | 1 | 0.0 |
| 15-19 | 0 | 0.0 | 0 | 0.0 | 0 | 0.0 | 0 | 0.0 | 0 | 0.0 |
| 20-24 | 1 | 0.1 | 0 | 0.0 | 0 | 0.0 | 0 | 0.0 | 1 | 0.0 |
| 25-29 | 0 | 0.0 | 0 | 0.0 | 0 | 0.0 | 0 | 0.0 | 0 | 0.0 |
| 30-34 | 13 | 1.4 | 8 | 0.9 | 0 | 0.0 | 1 | 1.0 | 23 | 1.1 |
| 35-39 | 35 | 3.5 | 36 | 3.6 | 1 | 1.1 | 4 | 4.0 | 77 | 3.4 |
| 40-44 | 134 | 12.3 | 127 | 11.7 | 16 | 16.9 | 12 | 11.3 | 290 | 12.0 |
| 45-49 | 297 | 28.7 | 187 | 18.1 | 41 | 49.5 | 35 | 36.6 | 563 | 24.7 |
| 50-54 | 515 | 56.6 | 362 | 39.1 | 61 | 91.6 | 33 | 42.3 | 978 | 48.8 |
| 55-59 | 868 | 120.7 | 576 | 76.8 | 81 | 171.6 | 50 | 90.2 | 1,579 | 99.3 |
| 60-64 | 1,212 | 217.7 | 879 | 146.7 | 115 | 313.1 | 80 | 178.9 | 2,288 | 183.1 |
| 65-69 | 1,608 | 362.0 | 1,056 | 207.7 | 131 | 448.0 | 84 | 214.7 | 2,886 | 280.4 |
| 70-74 | 1,997 | 537.4 | 1,361 | 282.8 | 157 | 670.3 | 91 | 273.7 | 3,617 | 395.2 |
| 75-79 | 1,867 | 604.2 | 1,342 | 299.4 | 118 | 658.8 | 101 | 373.2 | 3,440 | 426.9 |
| 80-84 | 1,238 | 641.2 | 913 | 269.8 | 74 | 737.4 | 60 | 332.2 | 2,290 | 407.9 |
| 85+ | 722 | 545.7 | 714 | 213.9 | 39 | 542.7 | 45 | 257.9 | 1,522 | 309.1 |
