Table of Contents
Section 3-5: Lung
Table 3.6-1: Comparison of Incidence Rates by Race
Table 3.6-2: Comparison of Mortality Rates by Race
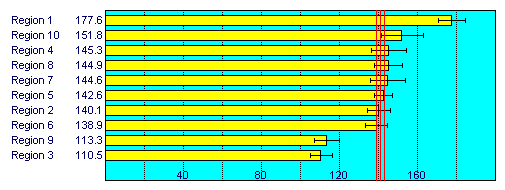
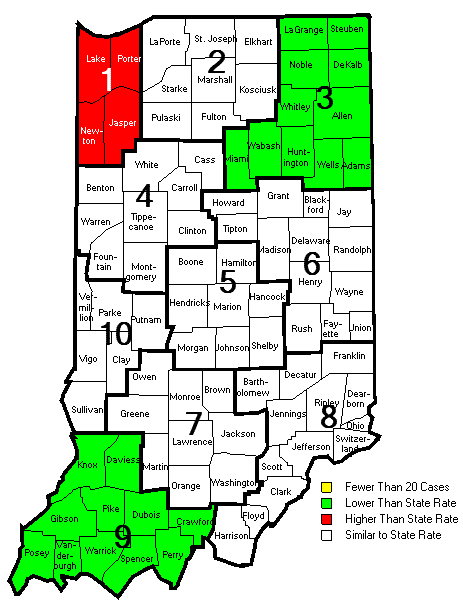
Table 3.6-3: Comparison of State and Regional Incidence Rates (below)
Table 3.6-4: Comparison of State and Regional Mortality Rates
Table 3.6-5: Age-Specific Incidence Rates by Sex and Race
Table 3.6-6: Age-Specific Mortality Rates by Sex and Race
Table 3.6-7: Stage at Diagnosis
| Region | 2004 | 2000 - 2004 | ||||||
|---|---|---|---|---|---|---|---|---|
| Cases | Rate | LCI | UCI | Cases | Rate | LCI | UCI | |
| INDIANA | 3,627 | 130.3 | 126.1 | 134.7 | 18,721 | 140.9 | 138.9 | 142.9 |
| Region 1 | 500 | 157.8 | 144.0 | 172.6 | 2,677 | 177.6 | 170.8 | 184.6 |
| Region 2 | 388 | 114.3 | 103.1 | 126.5 | 2,275 | 140.1 | 134.3 | 146.0 |
| Region 3 | 406 | 135.4 | 122.4 | 149.5 | 1,613 | 110.5 | 105.2 | 116.2 |
| Region 4 | 197 | 133.1 | 115.0 | 153.5 | 1,048 | 145.3 | 136.6 | 154.5 |
| Region 5 | 808 | 129.1 | 120.2 | 138.6 | 4,134 | 142.6 | 138.2 | 147.1 |
| Region 6 | 470 | 139.7 | 127.3 | 153.2 | 2,273 | 138.9 | 133.2 | 144.8 |
| Region 7 | 184 | 119.4 | 102.6 | 138.6 | 1,050 | 144.6 | 135.8 | 153.8 |
| Region 8 | 290 | 122.9 | 108.9 | 138.5 | 1,607 | 144.9 | 137.7 | 152.3 |
| Region 9 | 239 | 104.8 | 91.8 | 119.3 | 1,245 | 113.3 | 107.1 | 119.9 |
| Region 10 | 144 | 136.7 | 115.1 | 161.8 | 785 | 151.8 | 141.3 | 163.0 |

The solid vertical lines show the calculated state rate (the middle line) and 95% confidence interval.

The regional rate is considered higher or lower than the state rate only if the confidence intervals of the two rates do not overlap. Otherwise the rates are considered similar. No comparison is made if the number of cases in the region is less than 20.