Table of Contents
Section 3-5: Lung
Table 3.6-1: Comparison of Incidence Rates by Race
Table 3.6-2: Comparison of Mortality Rates by Race
Table 3.6-3: Comparison of State and Regional Incidence Rates
Table 3.6-4: Comparison of State and Regional Mortality Rates
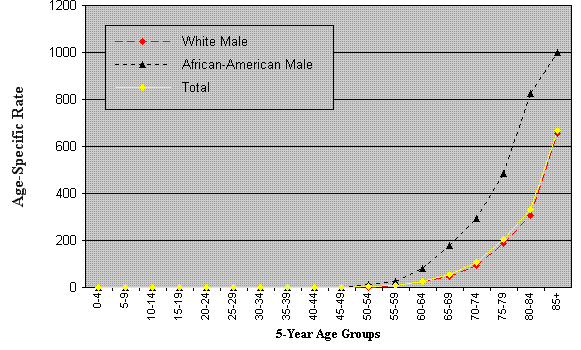
Table 3.6-5: Age-Specific Incidence Rates by Sex and Race
Table 3.6-6: Age-Specific Mortality Rates by Sex and Race (below)
Table 3.6-7: Stage at Diagnosis
| Age at Diagnosis | White Male | African-American Male | Total | |||
|---|---|---|---|---|---|---|
| Number | Rate | Number | Rate | Number | Rate | |
| 0-4 | 0 | 0.0 | 0 | 0.0 | 0 | 0.0 |
| 5-9 | 0 | 0.0 | 0 | 0.0 | 0 | 0.0 |
| 10-14 | 0 | 0.0 | 0 | 0.0 | 0 | 0.0 |
| 15-19 | 0 | 0.0 | 0 | 0.0 | 0 | 0.0 |
| 20-24 | 0 | 0.0 | 0 | 0.0 | 0 | 0.0 |
| 25-29 | 1 | 0.1 | 0 | 0.0 | 1 | 0.1 |
| 30-34 | 0 | 0.0 | 0 | 0.0 | 0 | 0.0 |
| 35-39 | 0 | 0.0 | 0 | 0.0 | 0 | 0.0 |
| 40-44 | 1 | 0.1 | 1 | 1.1 | 2 | 0.2 |
| 45-49 | 9 | 0.9 | 1 | 1.2 | 10 | 0.9 |
| 50-54 | 18 | 2.0 | 9 | 13.5 | 27 | 2.7 |
| 55-59 | 50 | 7.0 | 13 | 27.5 | 63 | 8.1 |
| 60-64 | 134 | 24.1 | 29 | 79.0 | 165 | 27.5 |
| 65-69 | 214 | 48.2 | 52 | 177.8 | 266 | 55.7 |
| 70-74 | 354 | 95.3 | 69 | 294.6 | 425 | 107.0 |
| 75-79 | 576 | 186.4 | 87 | 485.7 | 664 | 202.2 |
| 80-84 | 593 | 307.1 | 83 | 827.1 | 680 | 333.6 |
| 85+ | 865 | 653.8 | 72 | 1,001.9 | 938 | 669.8 |
