Table of Contents
Section 3-5: Lung
Table 3.6-1: Comparison of Incidence Rates by Race
Table 3.6-2: Comparison of Mortality Rates by Race
Table 3.6-3: Comparison of State and Regional Incidence Rates
Table 3.6-4: Comparison of State and Regional Mortality Rates
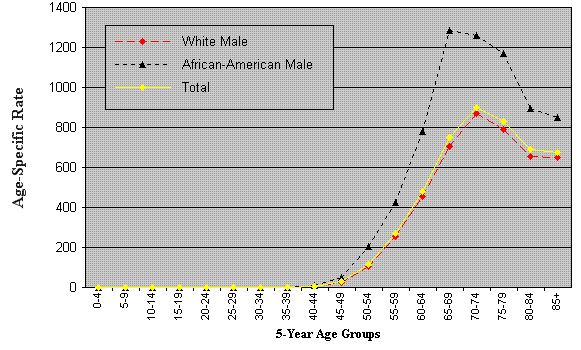
Table 3.6-5: Age-Specific Incidence Rates by Sex and Race (below)
Table 3.6-6: Age-Specific Mortality Rates by Sex and Race
Table 3.6-7: Stage at Diagnosis
| Age at Diagnosis | White Male | African-American Male | Total | |||
|---|---|---|---|---|---|---|
| Number | Rate | Number | Rate | Number | Rate | |
| 0-4 | 1 | 0.1 | 1 | 0.8 | 2 | 0.2 |
| 5-9 | 0 | 0.0 | 0 | 0.0 | 0 | 0.0 |
| 10-14 | 0 | 0.0 | 0 | 0.0 | 0 | 0.0 |
| 15-19 | 0 | 0.0 | 0 | 0.0 | 0 | 0.0 |
| 20-24 | 0 | 0.0 | 0 | 0.0 | 0 | 0.0 |
| 25-29 | 0 | 0.0 | 0 | 0.0 | 0 | 0.0 |
| 30-34 | 0 | 0.0 | 0 | 0.0 | 0 | 0.0 |
| 35-39 | 7 | 0.7 | 1 | 1.1 | 8 | 0.7 |
| 40-44 | 63 | 5.8 | 8 | 8.5 | 72 | 6.0 |
| 45-49 | 270 | 26.1 | 42 | 50.7 | 315 | 27.8 |
| 50-54 | 969 | 106.5 | 135 | 202.8 | 1,124 | 113.8 |
| 55-59 | 1,846 | 256.6 | 200 | 423.7 | 2,076 | 267.8 |
| 60-64 | 2,537 | 455.7 | 287 | 781.4 | 2,873 | 479.2 |
| 65-69 | 3,136 | 706.0 | 376 | 1,285.8 | 3,592 | 752.5 |
| 70-74 | 3,224 | 867.5 | 295 | 1,259.6 | 3,584 | 902.2 |
| 75-79 | 2,435 | 788.0 | 210 | 1,172.4 | 2,719 | 828.0 |
| 80-84 | 1,266 | 655.7 | 90 | 896.9 | 1,411 | 692.2 |
| 85+ | 860 | 650.0 | 61 | 848.9 | 945 | 674.8 |
