Language Translation
  Close Menu

Data Proficiency Program

  • MPH
  • Current: Data Proficiency Program

Data Proficiency for State Employees

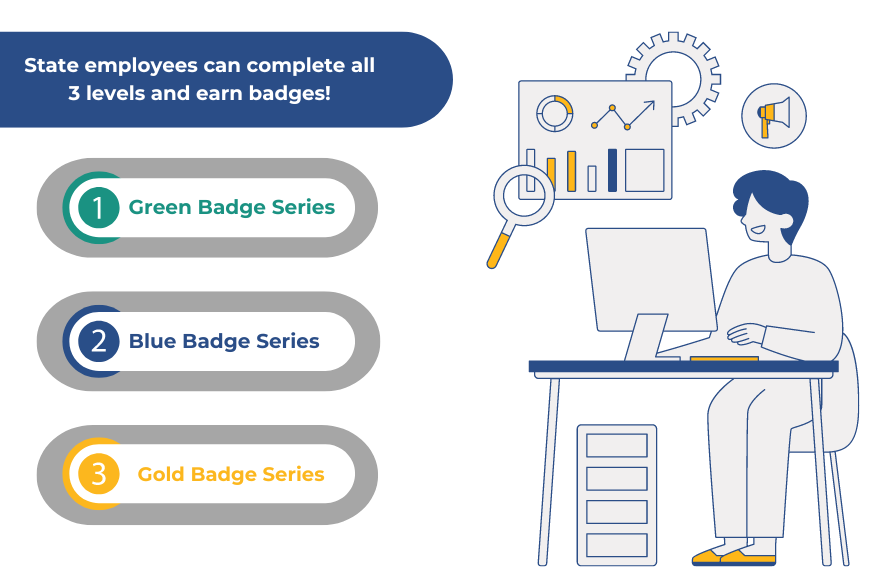
Graphic for data proficiency program with three badges.With the ever-increasing importance on data-driven decision making for state agencies to serve Hoosiers, it is important to create a culture of data proficiency across the state.

The collection, organization and analysis of data is a part of all state employees’ daily activities. From entering customer information to monitoring weather conditions to managing budgets, data drives operations for all agencies. Quality data input and analysis at every level impacts the quality of insights we can derive. Much like the acquisition and maintenance of physical assets, increasing the awareness of the impact of data empowers our agency to better support our customers.

The Management Performance Hub, the state’s data agency, is ready to help employees across the state understand their role in data and to skill-up. We have created a statewide data proficiency program that engages employees at all knowledge levels and shows how data impacts all of our jobs every day. This content will arrive in your inbox monthly. These short lessons explain data concepts with simple, real-life scenarios. Please be sure to treat this as any other state-issued training and take the time to review the material.

Data Proficiency Program Lessons

Welcome to Data 101 for state employees! This is just the start to improving your data knowledge and skills. MPH looks forward to continuing this journey with you. Learn how you can earn your Data Proficiency Program learning badges by completing the lessons.

The Data Proficiency Program training lessons are now available to state employees. Upon completion of each section quiz, state employees can expect to receive their badges via email from mph@subscriptions.in.gov.

Important: Badges are emailed every week on Tuesday.

We welcome all state employees to sign up via their state email account to receive future updates and news about our Data Proficiency Program. Subscribe to our mailing list to stay in touch with us.

Learn more about Badges
Data Proficiency Badge Program

Level 1: Green Badge Series

Lesson 1 - What is Data and Data Literacy?

Lesson one graphic

Whether it is filling out a customer intake form, using restaurant reviews to decide your dinner destination or reviewing the latest operational dashboard at your agency, each of us uses data on a daily basis to learn and guide our decision-making. Often, we interact with data without realizing it.


Go to Lesson 1


Lesson 2 - Misconceptions in Data Analysis

Lesson two graphic

Statistics are all around us every day. Most sources present these statistics as fact, but what do they really mean? Do they give you all the information you need to know?

Go to Lesson 2


Lesson 3 - Telling Stories with Data Visualizations

Lesson three graphic

From personal budgets to daily time logs, most people are familiar with spreadsheets that track various data points. When the amount of data becomes overwhelming, charts and graphics, also known as data visualizations, can become helpful in determining the story behind the data.

Go to Lesson 3


Lesson 4 - The Importance of Data Collection

Lesson four graphic

Government is known for its paperwork. Forms, information fields and clicks fill many of our days, whether we are the customer or the employee providing customer service. Each of these forms is a way to collect data. The data collected within these forms is critical to providing timely, accurate service or making determinations about eligibility for services.

Go to Lesson 4


Lesson 5 - Data in the News

Lesson five graphic

Every day, it seems that news outlets carry multiple stories about federal, state and local government agencies. Sometimes the stories have in-depth statistics or even copies of official government documents. Have you ever wondered how that information is obtained?

Go to Lesson 5

This lesson is the last lesson of Level 1 of the Data Proficiency Program. It's time for a knowledge check and a chance at earning your Level 1 - Green Badge.

Take the Green Badge Quiz


Level 2: Blue Badge Series

Lesson 6 - Indiana Transparency Portal

Lesson six graphic

The Indiana Transparency Portal (ITP) uses the latest in data delivery technology to provide a more user friendly and in-depth look into Indiana’s finances and assets. You can explore agency assets, state contracts, finances and more. It’s a lot of data available at your fingertips. So in this lesson, we’re going to introduce you to it and let you check it out for yourself.

Go to Lesson 6


Lesson 7 - Data in Sports

Lesson seven graphic

Sports data is more than just stats on trading cards or improving your standings in your fantasy football league. Across sports types, leagues and levels, teams are using data to improve their performance and win!

Go to Lesson 7


Lesson 8 - Understanding Election Data

Lesson eight graphic

Election data is a lot more than just the final vote tallies. In lesson 8, you’ll learn about the history of polling and polling data, plus how political polls monitor public opinion over time. Additionally, you'll learn more about how political campaigns use data to inform decisions and create voter files to their advantage.

Go to Lesson 8


Lesson 9 - Health Data

Lesson nine graphic

We’ve all become more aware of our health these last few years. One thing is for sure - data has played a significant role in this increased awareness. According to a recent article in Forbes, healthcare data accounts for roughly 30% of the world’s data volume.

Surely, you’ve encountered available public data about COVID-19, but even more data is available at your fingertips about your personal health through health apps and wearable devices. So with more and more data, it’s not always easy for everyone to make sense of it. Let's try in lesson 9!

Go to Lesson 9


Lesson 10 - Social Media Data

Lesson ten graphic

Social media sites are tracking our behaviors and have plenty of avenues available to suggest more content that we might like. Yes, even your social media interactions become data.

If you didn’t know you were being tracked, now is the time to get informed.

Go to Lesson 10

Once you've finished lessons 6-10, it's time for a knowledge check and a chance at earning your Level 2 - Blue Badge.

Take the Blue Badge Quiz


Level 3: Gold Badge Series

Lesson 11 - Know Your Data Privacy Rights

Lesson eleven graphic

As more of our data becomes digital, data privacy is taking on greater importance. The more that we can all understand about data privacy, the better we’ll be able to protect important data.

Go to Lesson 11


Lesson 12 - Keeping Data Secure

Lesson twelve graphic

Data security is the practice of protecting sensitive information from unauthorized access, use, disclosure, disruption, modification, or destruction. It encompasses a range of measures and controls that are implemented to safeguard data and ensure its confidentiality, integrity, and availability. As state employees, data security practices aren’t limited to your time on the clock. You should be taking the necessary steps to secure your personal data in your private lives as well.

Go to Lesson 12


Lesson 13 - How to Spot Credible Research

Lesson thirteen graphic

In a world where information is easily accessible but not always accurate, possessing data literacy skills to assess research credibility is vital. These skills include being able to navigate complex issues, make informed choices and contribute meaningfully to both personal and professional spheres.

This lesson provides an understanding on how to distinguish credible research, essential in today's information-driven world.

Go to Lesson 13


Lesson 14 - Preventing Data Mistakes

Lesson fourteen graphic

Data mistakes can happen to anyone. Users are responsible in acquiring the skills that identify and correct pitfalls in data handling. As state employees, it is our responsibility to differentiate errors from more sinister intentions to prevent serious consequences from our work.

Go to Lesson 14


Lesson 15 - Data Context

Lesson fifteen graphic

As professionals working for the state, we regularly encounter new information throughout our workdays. Yet, true comprehension allows us to apply our knowledge effectively and leads to better-informed decisions for our work teams, our agencies and the state as a whole.

Go to Lesson 15

Lesson 16 - Find Your Own Data

Lesson sixteen graphic

There are many places to get data, like online databases, government repositories, and special data hubs. Open data is quite useful for those looking to explore and analyze data for learning or research purposes.

Go to Lesson 16

Once you've finished lessons 11-16, it's time for a knowledge check and a chance at earning your Level 3 - Gold Badge.

Take the Gold Badge Quiz

All MPH Projects

See additional custom analytics solutions created by MPH.

View the MPH Projects List

Visit the Indiana DATA Hub

Browse and download the State of Indiana’s publicly-available datasets to gain insight into current data trends around the state.

Visit the Indiana Data Hub

Request Data

Discover your own insights by requesting data from MPH.

Request Data