Summary
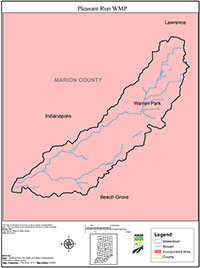
The Pleasant Run Watershed Management Plan summarizes data describing the health of Pleasant Run, Bean Creek, and their tributaries, lists pollution sources, and sets goals to protect and restore the streams’ water quality. Implementation measures described in the plan include public education and land use practices such as trees, rain gardens, and small wetlands that will improve water quality. Friends of Pleasant Run, an all-volunteer group, worked with the public and local groups and government over the course of 18 months on this plan.
Water quality data for Pleasant Run comes from the Indiana Department of Environmental Management (IDEM), Marion County Health Department (MCHD), and Indianapolis Department of Public Works (DPW). All three sets of data show that bacteria is a problem; in fact IDEM has put Pleasant Run and Bean Creek on a list of streams that don’t meet Indiana’s bacteria standard. MCHD data shows that levels of Dissolved Oxygen, which aquatic life needs to breathe, are low at the beginning of both Pleasant Run and Bean Creek. These measurements are still within acceptable ranges, but their low value, relative to downstream measurements, indicates a need for improvement. Finally, nutrients are a problem in Pleasant Run Watershed. DPW data shows that nitrogen and phosphorus are high along Pleasant Run near 16th Street and near Meridian Street.
IDEM and MCHD also collected data on Benthic Macroinvertebrates—animals without backbones that are big enough to be seen with the naked eye. Benthic Macroinvertebrates live their entire life in the streams, so their presence gives us an idea of how good a habitat the stream provides. MCHD’s Macro scores along Bean Creek are ‘Fair’ to ‘Fairly Poor’. Pleasant Run had a wider variety of scores. The most upstream site scored ‘Poor’ to ‘Very Poor’ while further downstream scores ranged from ‘Fair’ to ‘Good’.
Many different sources contribute to the water quality problems we found in the watershed. The Combined Sewer Overflow (CSO) system, which dumps raw sewage into the streams at 55 different points when storms overflow the sewer capacity, contributes bacteria and nutrients. Also, DPW has identified 15 neighborhoods with leaking septic systems which contribute bacteria and nutrients. Both pollutants are also found in animal waste around the watershed’s 42 storm water ponds and streambanks. Nutrients from over-applied fertilizer also run off from residential and commercial property. If buffered with vegetation, stream edges can act as filters that keep fertilizer and other pollution out of the water. However, over 14 of the watershed’s 31 stream miles are poorly buffered. Lastly, storm water that comes from roofs, streets, driveways, and parking lots contribute water pollution. The amount of paved surface in a square block range from 40% to 100%. The impervious surface sends polluted runoff to the streams where it scours the stream channel and erodes the banks.
It is hoped that the community can work toward implementing these objectives and enjoying a cleaner watershed. Implementation can be as simple as addressing runoff pollution at home or working to secure grant funds to pay for larger scale activities.

