December 2023
INDOT has implemented a new tool, called Traffic Viewer, to display needed traffic data information quickly and easily, even on smartphones.
Traffic Viewer supplements INDOT’s established online method of viewing traffic data, called the Traffic Count Database System (TCDS). Although TCDS is powerful and offers access to all the detailed traffic data collected, the system can be overwhelming at first sight. Finding the desired information is often not intuitive or efficient.
“The TCDS has lots of information but can be intimidating for new or casual visitors,” said INDOT Traffic Statistics Supervisor Greg Katter. “It’s like drinking through a firehose. The sought-after information can get lost in the clutter and take a lot of clicks to find.”
Traffic Viewer, which was developed by the same vendor, was implemented this fall by INDOT and is available on INDOT’s website.
“Traffic Viewer is a more map-based presentation of the same data,” said Katter. “The look is much cleaner, and the most commonly sought information pops right out, saving the user time with fewer clicks and much less confusion.”
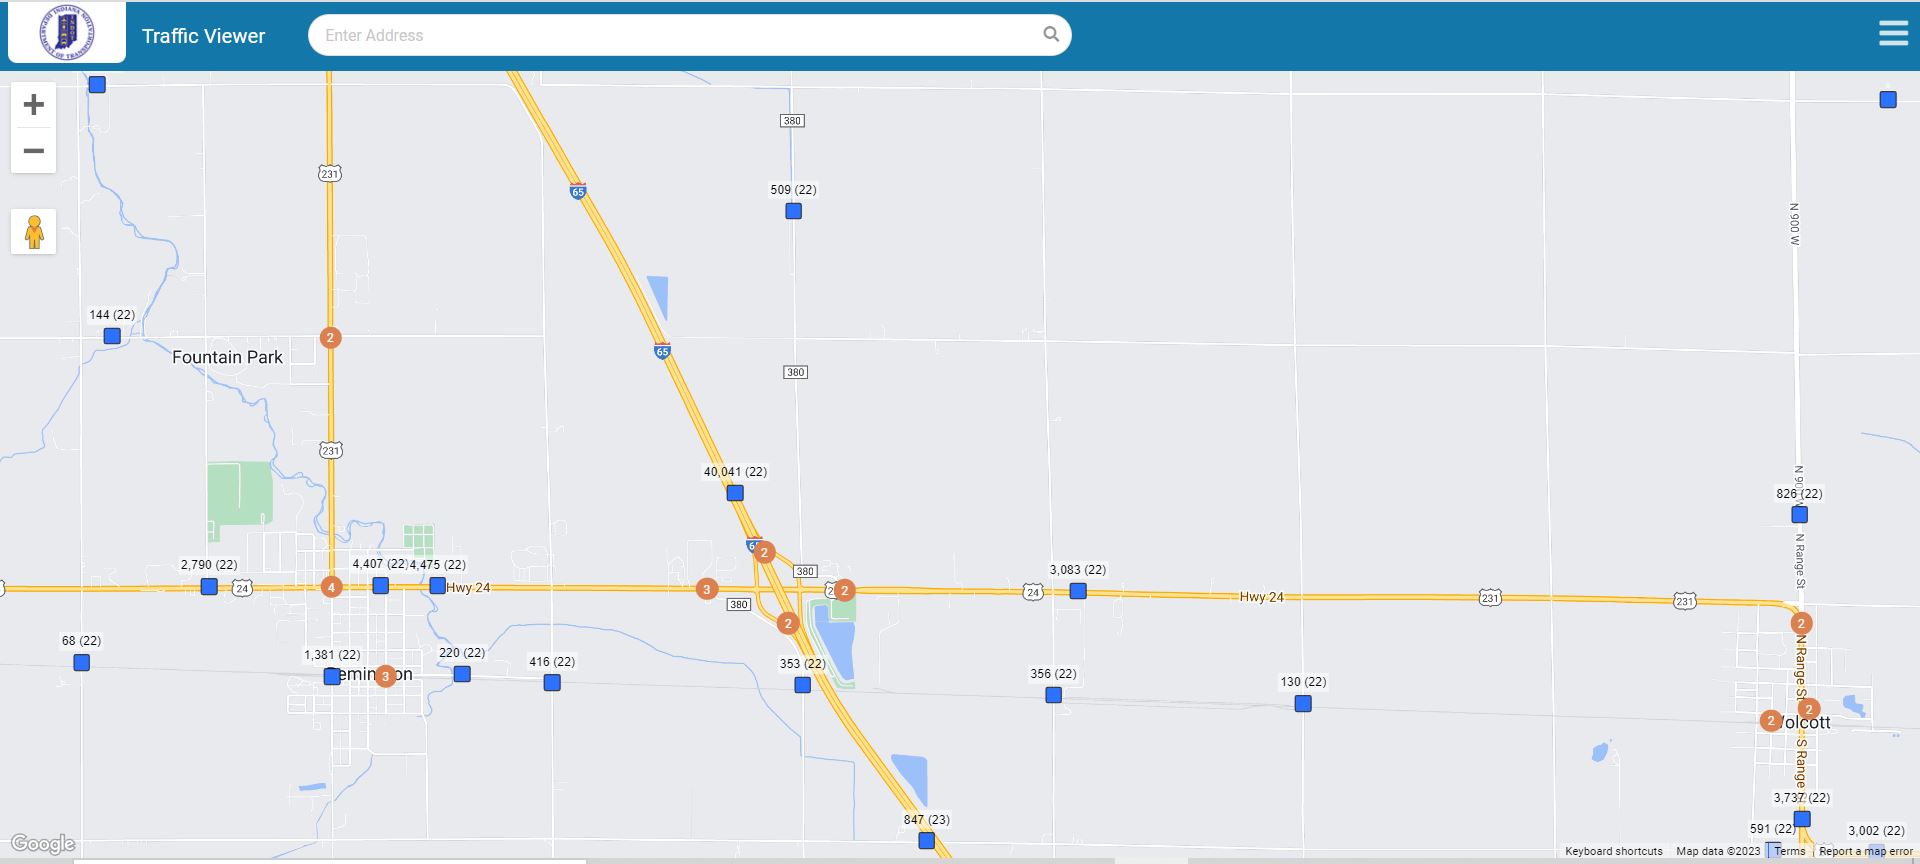
The new system opens with a map of Indiana featuring dozens of orange circles. Each circle represents how many traffic-count stations are in that vicinity. When the user zooms in, the circles switch from being labeled as the number of count locations in the vicinity to the actual traffic-count locations, represented by blue squares.
Each square has two numbers. The first number represents the annual average daily traffic (AADT). The second number represents the year for which the AADT applies, either 2023 or 2022. Besides seeing this bird’s-eye view, users can drill down for more information by clicking the blue square, which results in a choice of table view or graph view of the information.
· Table view: After the description of the road, there is up to 10 years of historical data for two-way traffic, negative-direction traffic (generally southbound or westbound), and positive-direction traffic (generally northbound or westbound). Each of these categories displays total AADT plus how much of that total involves passenger vehicles (PA) and commercial vehicles (BC). If users click into any of these boxes, they can see hourly counts by date.
· Graph view: This mode takes the basic table-view information and displays it in graph-table form.
The menu in the upper right enables users to switch between map and satellite view, display the location IDs, and switch to the TCDS. There’s even a drag-and-drop Google Street View function.
The mobile-friendly aspect makes Traffic Viewer that much more valuable.
“The interface not only provides a quicker way to get information via a computer, but it’s easy to use on a phone,” said Katter. “All you need to do is use your fingers to zoom in, pan around, and tap on a location.”
The new Traffic Viewer can aid INDOT Construction project managers, customer service representatives, executives, and many others.
The public could find great use with Traffic Viewer, including looking up statistics for proposed projects that impact them or browsing out of sheer curiosity.
“The first thing anyone wants see is the activity going on around their house,” said Katter. “That’s the first thing I did with Traffic Viewer. I searched the roads that are near where I live. The information is interesting.”

